What Is Total Stock Return?
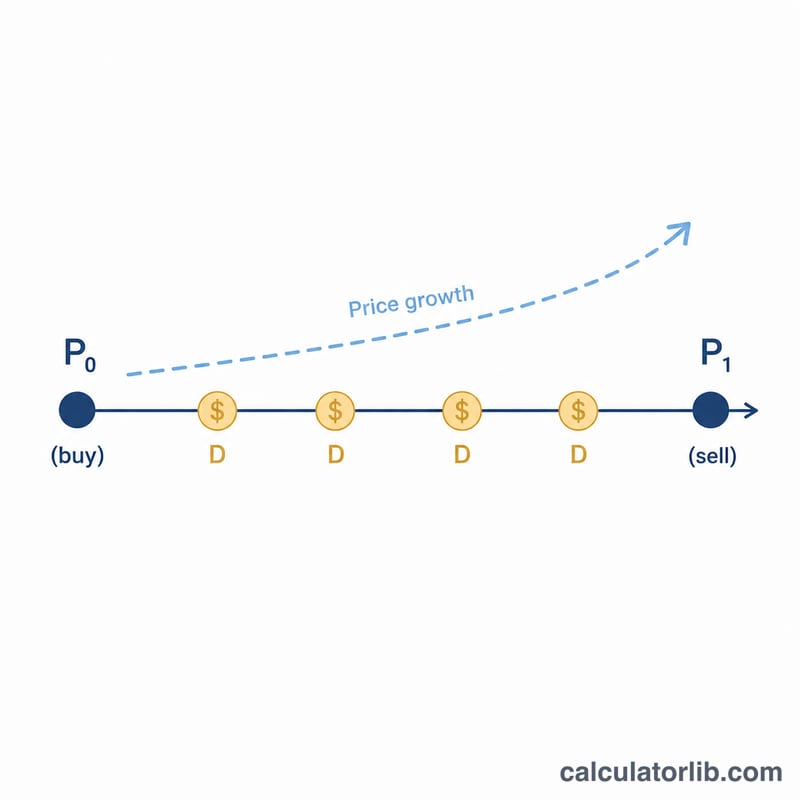
Total stock return measures the complete gain you earn from owning a stock, combining two sources: the capital gain (the change in share price) and the dividend income you collect while holding it. Looking only at price movement understates your real return, because dividends can add meaningfully to performance — especially over long holding periods.
How to Use This Calculator
Enter the price you paid per share (P0), the price you sold at or its current value (P1), the total dividends received per share, and how many shares you own. The calculator returns your total return as a percentage along with a dollar breakdown of profit, capital gain, dividend income, cost basis, and final value.
The Formula Explained
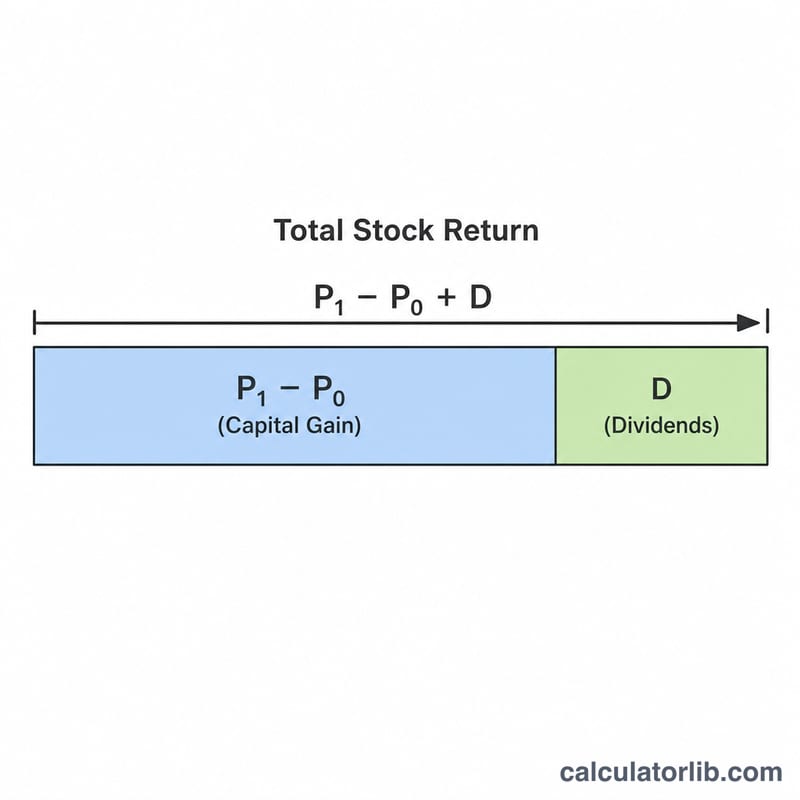
The core equation is:
$$\text{Total Return \%} = \frac{\left(\text{P1} - \text{P0}\right) + \text{Dividends}}{\text{P0}} \times 100$$
The numerator is your total gain per share — the price difference plus dividends. Dividing by your purchase price \(\text{P0}\) expresses that gain relative to what you invested, and multiplying by 100 turns it into a percentage.
Worked Example
Suppose you bought a stock at $100, sold it at $120, and received $5 in dividends per share, holding 10 shares. Total gain per share = \((120 - 100) + 5 = \$25\). Total return = $$\frac{(120 - 100) + 5}{100} \times 100 = 25\%$$ Across 10 shares, your total profit is $250 on a $1,000 cost basis.
FAQ
Does this account for taxes or fees? No — it shows gross return. Subtract commissions and taxes for your net figure.
Is this an annualized return? No, it is the cumulative return over your holding period. To annualize, factor in the number of years held.
What if I had a loss? If P1 is below P0 and dividends do not offset it, the return will be negative, indicating a net loss.