What Is the Stock Profit / Return Calculator?
This calculator tells you exactly how much money you made (or lost) on a stock trade and what that gain represents as a percentage return. It accounts for the buy price, the sell price, the number of shares traded, and any brokerage fees or commissions, giving you a clean net figure rather than a misleading gross number.
How to Use It
Enter the price you paid per share, the price you sold for, the total number of shares, and your combined buy + sell fees. The calculator returns your net profit, your return on investment (ROI), and a breakdown of total cost, total proceeds, and total invested capital. Leave fees at 0 for a quick gross estimate.
The Formula Explained
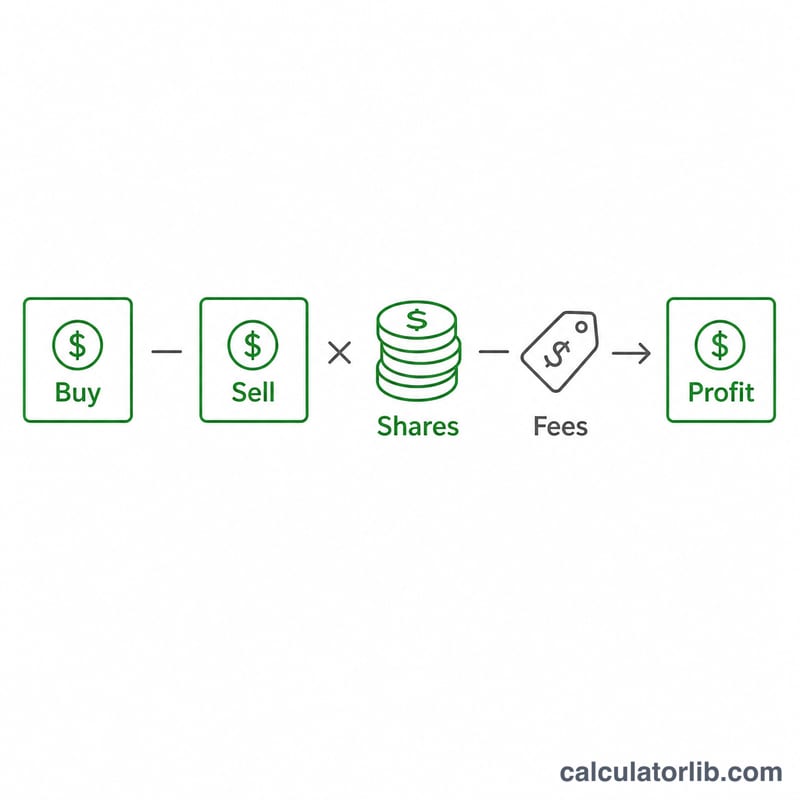
Net profit is the difference between sell and buy price multiplied by the number of shares, minus fees: $$\text{Profit} = (\text{Sell} - \text{Buy}) \times \text{Shares} - \text{Fees}$$ ROI measures that profit against what you actually committed: $$\text{ROI} = \frac{\text{Profit}}{(\text{Buy} \times \text{Shares}) + \text{Fees}} \times 100$$ Using total invested (including fees) in the denominator gives a more honest return figure than using cost alone.
Worked Example
Suppose you buy 10 shares at $100 each and sell them at $120, paying $15 in total fees. $$\text{Profit} = (120 - 100) \times 10 - 15 = \$200 - \$15 = \$185$$ Total invested \(= (100 \times 10) + 15 = \$1{,}015\). $$\text{ROI} = \frac{185}{1{,}015} \times 100 \approx 18.23\%$$
Interpreting Your Result
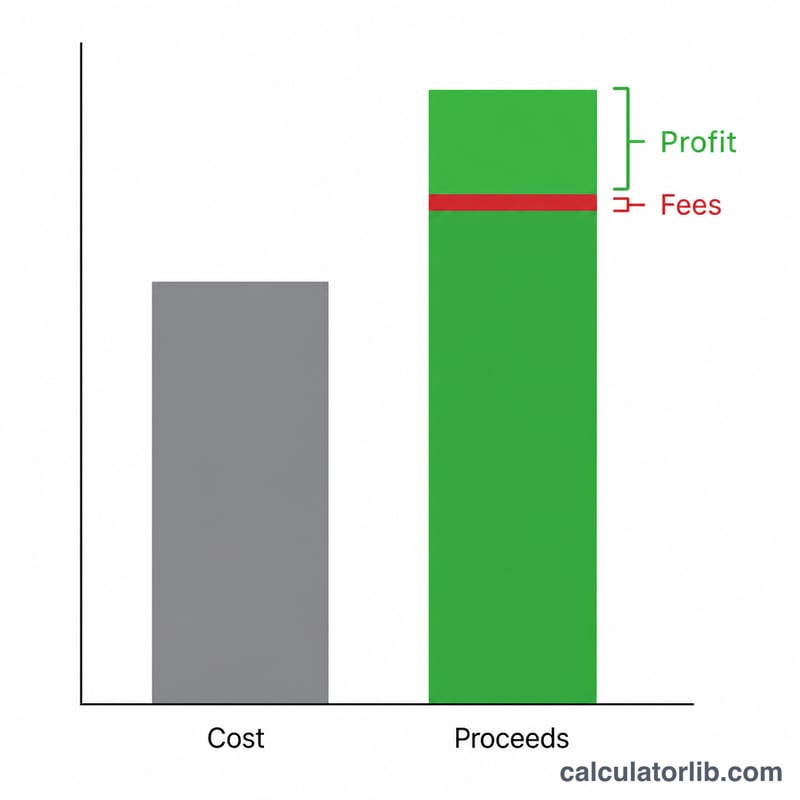
The calculator returns two numbers: net profit in currency and ROI as a percentage. Net profit is simply what the trade added to or removed from your account:
$$\text{Profit} = (\text{Sell} - \text{Buy}) \times \text{Shares} - \text{Fees}$$ROI expresses that profit as a share of the capital you actually committed, which is the purchase cost plus the fees you paid to get in and out:
$$\text{ROI} = \frac{(\text{Sell} - \text{Buy}) \times \text{Shares} - \text{Fees}}{\text{Buy} \times \text{Shares} + \text{Fees}} \times 100\%$$ROI is a total return, not a yearly rate
This ROI covers the entire holding period, whether that was three days or nine years. It says nothing about speed. To compare a trade against a yearly rate (a savings rate, a bond yield, another trade held for a different length of time), convert it to an annualized or compound annual growth rate (CAGR):
$$\text{Annualized return} = (1 + \text{ROI})^{1/\text{Years}} - 1$$For example, a total ROI of 18.23% earned over two years annualizes to:
$$(1 + 0.1823)^{1/2} - 1 = 1.0873 - 1 = 0.0873 = 8.73\%\ \text{per year}$$The same 18.23% earned over six months annualizes much higher — \((1.1823)^{1/0.5} - 1 = 39.8\%\) per year — and over five years it drops to \((1.1823)^{1/5} - 1 = 3.4\%\) per year. Two trades with identical ROI are not comparable until you divide by time.
Negative profit vs. negative ROI
Net profit and ROI always share the same sign, because ROI is just the profit divided by a positive denominator. A negative profit of −$1,212 on $8,012 committed is an ROI of −15.13%; the currency figure tells you how much money is gone, the percentage tells you how large that loss was relative to the position. Watch for the case where the price rose but the result is still negative: if the gross gain \((\text{Sell} - \text{Buy}) \times \text{Shares}\) is smaller than the fees, the trade was profitable on paper and a loss in reality.
Break-even sell price
Setting profit to zero and solving for the sell price gives the price at which the trade merely returns your money:
$$\text{Sell}_{\text{break-even}} = \text{Buy} + \frac{\text{Fees}}{\text{Shares}}$$Buying 10 shares at $50.00 with $10.00 of total round-trip fees:
$$\text{Sell}_{\text{break-even}} = \$50.00 + \frac{\$10.00}{10} = \$50.00 + \$1.00 = \$51.00$$So the price must rise 2.0% before the position is worth anything. Selling instead at $55.00 produces a net profit of $40.00. With 500 shares and the same $10 fee, break-even is $50.02 — a 0.04% move.
Why fees hurt small positions most
Fees are usually a fixed or near-fixed amount per order, while the position size is not. The drag they impose is \(\text{Fees} / (\text{Buy} \times \text{Shares} + \text{Fees})\): $10 of fees on a $500 position consumes 1.96% of your capital before the price moves, while $10 on a $25,000 position consumes 0.04%. That is why the same percentage price move can produce very different ROI figures on small and large trades.
What this figure does not include
- Pre-tax. No capital gains tax, withholding tax or loss offset is applied. Tax treatment of a share sale differs by country and by how long you held the position, so your after-tax outcome may be materially lower.
- Pre-dividend. Dividends, distributions and stock lending income received while holding are not counted, so the total return on a dividend-paying holding is higher than this ROI.
- Single currency. Buy and sell prices are assumed to be in the same currency. For a foreign-listed share, the exchange rate move between purchase and sale can change the result substantially and is not modelled here.
- Not a benchmark comparison. A positive ROI is not evidence of a good decision and a negative one is not evidence of a bad one; this tool does not compare your result to an index, to inflation, or to any alternative use of the money.
- Nominal, not inflation-adjusted, and it ignores margin interest, account fees and bid–ask spread beyond what you enter in the fees field.
This section is general information about a calculation, not investment, tax or financial advice, and it contains no judgement about whether any position should be bought, sold or held. For decisions about your own portfolio or tax position, consult a licensed professional in your jurisdiction.
Key Terms Explained
- Buy price
- The price paid per share at execution — the actual fill price, not the quote you saw before ordering. If you built the position in several fills, use the weighted average price per share.
- Sell price
- The price received per share when the position was closed. For an unsold holding, enter the current market price to model a hypothetical result.
- Shares
- The quantity of shares bought and sold. The formula assumes the same quantity on both sides; for a partial sale, enter only the number of shares actually sold.
- Total cost (cost basis, before fees)
- \(\text{Buy} \times \text{Shares}\) — the money handed over for the shares themselves. 100 shares at $80 is a total cost of $8,000.
- Total proceeds
- \(\text{Sell} \times \text{Shares}\) — the gross amount the sale brought in, before fees are deducted.
- Fees / commissions
- The combined cost of both legs of the trade: buy commission plus sell commission, plus any platform, exchange, clearing, regulatory, stamp-duty or transfer charges that applied. Enter one combined figure. Where a charge applies only to one side (several national markets levy a transaction tax on purchases or on sales only), include it once.
- Total invested
- \(\text{Buy} \times \text{Shares} + \text{Fees}\) — all the capital the trade required. This is the denominator of the ROI shown here, which is why ROI falls slightly as fees rise even when the profit is unchanged.
- Gross profit
- \((\text{Sell} - \text{Buy}) \times \text{Shares}\) — the price gain alone, ignoring costs.
- Net profit
- Gross profit minus fees. This is the figure that actually changed your account balance, and it can be negative while gross profit is positive.
- ROI (return on investment)
- Net profit expressed as a percentage of capital committed: \(\text{Net profit} / \text{Total invested} \times 100\%\). It is a total return for the whole holding period.
- Break-even price
- The sell price at which net profit is exactly zero: \(\text{Buy} + \text{Fees}/\text{Shares}\). Below it the trade loses money even if the share price rose.
- Realized gain
- A gain or loss locked in by an actual sale — what this calculator measures once you enter a real sell price. In most tax systems, only realized gains are reportable events.
- Unrealized gain (paper gain)
- The change in value of a position still held. It fluctuates with the market and becomes realized only on sale.
- Capital gain
- The profit attributable to the rise in the share's price (proceeds minus cost basis). Many tax codes allow trading fees to be added to the basis or deducted from proceeds, which makes the taxable capital gain closer to net profit than to gross profit — the exact rule depends on your country.
- ROI vs. annualized return (CAGR)
- ROI is cumulative and time-blind; CAGR, \((1 + \text{ROI})^{1/\text{Years}} - 1\), restates it as an equivalent constant yearly rate. A 20% ROI is a 20% CAGR only if the holding period was exactly one year — over four years it is 4.66% per year.
Profit and ROI Across Common Scenarios
Every row below uses the same two formulas: net profit \(= (\text{Sell} - \text{Buy}) \times \text{Shares} - \text{Fees}\), and ROI \(= \text{Net profit} / (\text{Buy} \times \text{Shares} + \text{Fees})\). The first two rows share an identical 10% price move, so the only thing separating their returns is fee drag.
| Scenario | Buy price | Sell price | Shares | Fees | Total invested | Net profit | ROI% |
|---|---|---|---|---|---|---|---|
| Small winning trade | $50.00 | $55.00 | 10 | $10.00 | $510.00 | +$40.00 | +7.84% |
| Large winning trade (same price move) | $50.00 | $55.00 | 500 | $20.00 | $25,020.00 | +$2,480.00 | +9.91% |
| Flat price, fees create a loss | $20.00 | $20.00 | 100 | $15.00 | $2,015.00 | −$15.00 | −0.74% |
| Losing trade | $80.00 | $68.00 | 100 | $12.00 | $8,012.00 | −$1,212.00 | −15.13% |
| High-priced share, few shares | $420.00 | $455.00 | 5 | $14.00 | $2,114.00 | +$161.00 | +7.62% |
How two of these resolve, step by step:
- Small winner: \((\$55.00 - \$50.00) \times 10 = \$50.00\) gross; \(\$50.00 - \$10.00 = \$40.00\) net; \(\$40.00 / \$510.00 = 7.84\%\). The 10% price gain became a 7.84% return.
- Large winner: \((\$55.00 - \$50.00) \times 500 = \$2{,}500.00\) gross; \(\$2{,}500.00 - \$20.00 = \$2{,}480.00\) net; \(\$2{,}480.00 / \$25{,}020.00 = 9.91\%\). The identical 10% price gain kept almost all of its value.
Takeaway: fees behave like a fixed toll rather than a percentage — $10–$20 is a 2% hurdle on a $500 position and a rounding error on a $25,000 one, so the smaller the position, the larger the price move required just to reach break-even.
FAQ
Does it include taxes? No. The result is pre-tax. Capital gains tax depends on your jurisdiction and holding period, so subtract that separately.
What counts as fees? Include both the buy-side and sell-side commissions, plus any regulatory or transfer charges, as a single combined number.
Can I see a loss? Yes. If your sell price is below your buy price or fees exceed the gain, the net profit and ROI will display as negative.