What is a Reverse Inflation Calculator?
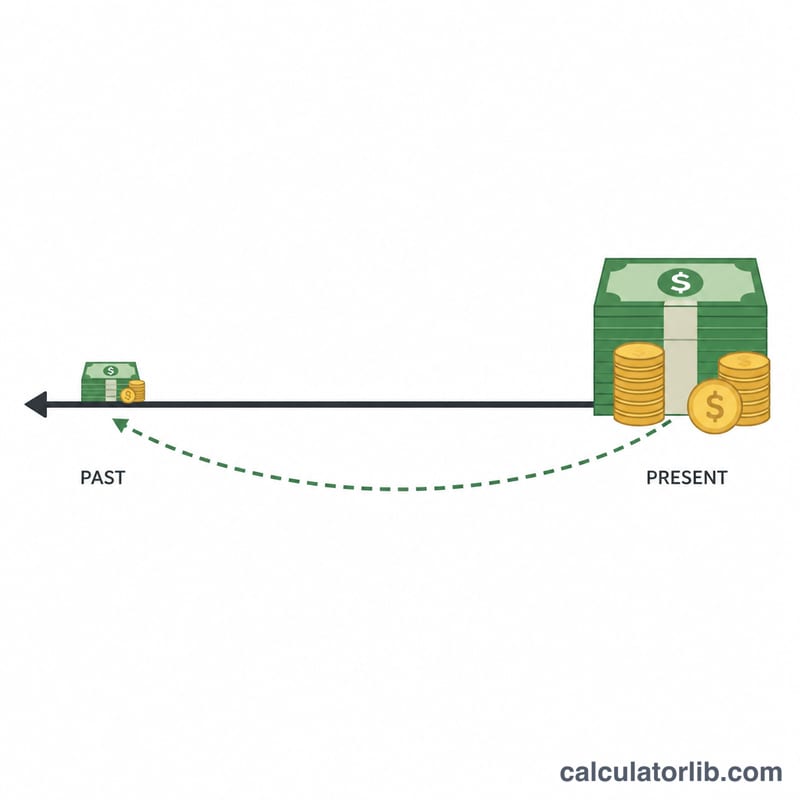
A reverse inflation calculator is a financial tool that helps you determine the past value of money compared to its present value, taking into account the effects of inflation over time. Unlike a standard inflation calculator that shows how much today's money will be worth in the future, a reverse inflation calculator works backward to show what today's money was worth in the past.
When to Use a Reverse Inflation Calculator
You might find a reverse inflation calculator useful in several scenarios:
- Comparing historical prices to current prices to understand purchasing power changes
- Analyzing the real value of past investments or assets in today's money
- Evaluating the true cost of goods and services over time for economic research or budgeting
How to Calculate
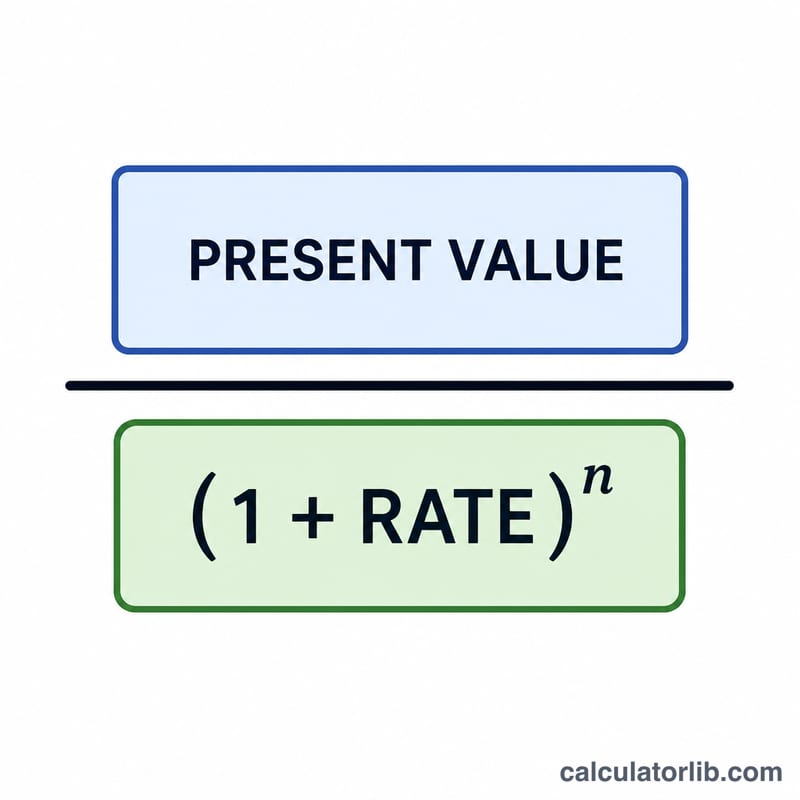
The reverse inflation calculation uses the following formula to find the past value of money:
$$\text{Past Value} = \frac{\text{Present Value}}{\left(1 + \frac{\text{Inflation Rate (\%)}}{100}\right)^{\text{Number of Years}}}$$
After calculating the past value, you can determine:
$$\text{Total Change} = \text{Present Value} - \text{Past Value}$$
$$\text{Percentage Change} = \frac{\text{Total Change}}{\text{Past Value}} \times 100$$
Examples
Example 1: Calculating the Value of Money 10 Years Ago
How much would $100 today have been worth 10 years ago, assuming an average inflation rate of 2.5% per year?
| Input | Value |
|---|---|
| Present Value | $100 |
| Inflation Rate | 2.5% |
| Number of Years | 10 |
Using the formula: $$\text{Past Value} = \$100 / \left(1 + 2.5/100\right)^{10}$$
$$\text{Past Value} = \$100 / \left(1.025\right)^{10}$$
$$\text{Past Value} = \$100 / 1.280085$$
Results:
| Result | Value |
|---|---|
| Past Value | $78.12 |
| Total Change | $21.88 |
| Percentage Change | 28.01% |
This means that $78.12 ten years ago had the same purchasing power as $100 today, representing a 28.01% increase due to inflation.
Example 2: Comparing House Prices Over 30 Years
If a house costs $400,000 today, what would have been its equivalent value 30 years ago with an average inflation rate of 3% per year?
| Input | Value |
|---|---|
| Present Value | $400,000 |
| Inflation Rate | 3% |
| Number of Years | 30 |
Using the formula: $$\text{Past Value} = \$400{,}000 / \left(1 + 3/100\right)^{30}$$
$$\text{Past Value} = \$400{,}000 / \left(1.03\right)^{30}$$
$$\text{Past Value} = \$400{,}000 / 2.427262$$
Results:
| Result | Value |
|---|---|
| Past Value | $164,794.29 |
| Total Change | $235,205.71 |
| Percentage Change | 142.73% |
This means a house worth $400,000 today would have cost approximately $164,794.29 thirty years ago, showing a 142.73% increase in price due to inflation.
Factors Affecting Reverse Inflation Calculations
Several factors can influence the accuracy of reverse inflation calculations:
- The inflation rate used (national averages vs. specific regional rates)
- Changes in calculation methods for inflation over time
- Specific price changes for different categories of goods and services
- Economic events such as recessions or periods of high inflation
For the most accurate calculations, use inflation data specific to your region and time period of interest.
Related calculators
- Inflation Calculator — value change over time.
- CPI Inflation Calculator — adjust US dollars for inflation.
Historical U.S. Inflation Rates by Year
The table below lists the annual average change in the U.S. Consumer Price Index for All Urban Consumers (CPI-U, U.S. city average, all items), as published by the U.S. Bureau of Labor Statistics (BLS). These are calendar-year averages, not December-to-December changes, which can differ by a few tenths of a percentage point.
| Year | Rate (%) | Year | Rate (%) | Year | Rate (%) |
|---|---|---|---|---|---|
| 2000 | 3.4 | 2009 | −0.4 | 2018 | 2.4 |
| 2001 | 2.8 | 2010 | 1.6 | 2019 | 1.8 |
| 2002 | 1.6 | 2011 | 3.2 | 2020 | 1.2 |
| 2003 | 2.3 | 2012 | 2.1 | 2021 | 4.7 |
| 2004 | 2.7 | 2013 | 1.5 | 2022 | 8.0 |
| 2005 | 3.4 | 2014 | 1.6 | 2023 | 4.1 |
| 2006 | 3.2 | 2015 | 0.1 | 2024 | 2.9 |
| 2007 | 2.8 | 2016 | 1.3 | ||
| 2008 | 3.8 | 2017 | 2.1 |
Average annualized rates over common horizons
Because inflation compounds, a multi-year average must be a geometric (annualized) average, not a simple arithmetic mean of the yearly rates:
$$r_{\text{avg}} = \left(\prod_{i=1}^{n}(1 + r_i)\right)^{1/n} - 1$$The figures below are computed from the CPI-U annual averages above, for periods ending with 2024. Use one of them as the inflationRate input when you want a realistic long-run assumption rather than a round number.
| Horizon | Years covered | Annualized rate (%) | Cumulative price increase |
|---|---|---|---|
| Last 5 years | 2020–2024 | ≈ 4.2 | ≈ +22.6% |
| Last 10 years | 2015–2024 | ≈ 2.8 | ≈ +32.3% |
| Last 20 years | 2005–2024 | ≈ 2.6 | ≈ +65.6% |
| Last 30 years | 1995–2024 | ≈ 2.5 | ≈ +111.4% |
Notes on using this data
- United States only. Every rate on this page is a U.S. CPI-U figure. Other countries publish their own official series — the UK Office for National Statistics (CPI/CPIH), Eurostat (HICP), Statistics Canada, the Australian Bureau of Statistics, Japan's Statistics Bureau — and their inflation histories differ substantially. Use your own country's national statistics agency for local comparisons.
- Use published figures only. Do not estimate a missing year. If you need a year not shown here, take it from the BLS CPI databases (or your national agency) rather than interpolating.
- Recent figures may be provisional. A current or very recent year's annual average is only final once all twelve monthly index values are published, and index values can be subject to revision or reseasonalization. Treat the newest figure as preliminary until confirmed at the source.
- Annual average vs December-to-December. Headline news often quotes the 12-month change to a specific month. That number will not exactly match the calendar-year average used here.
Inflation in United States: the official figures
Official consumer-price data for United States, updated automatically. Use these figures as inputs in the calculator above.
- 12-month change, September 2026
- +3.7%
- Inflation 2024
- 2.9%
- Cumulative 2015–2024
- 32.3%
- Average per year
- 3.2%
Latest change Up +0.3 pp September 2026: +3.7%, against +3.4% in August 2026.
Latest month (September 2026): consumer prices in United States changed by +3.7% over 12 months (Consumer Price Index for All Urban Consumers, CPI-U). The yearly figures below are annual averages. CalculatorLib calculates this change from the published index: index of the month ÷ index of the same month a year earlier − 1.
Prices in United States changed by 32.3% between 2015 and 2024, an average of 3.2% a year: what cost 100 USD in 2015 cost about 132 USD in 2024.
| Year | CPI (2010 = 100) | Inflation | World |
|---|---|---|---|
| 2024 | 143.9 | 2.9% | 3.0% |
| 2023 | 139.7 | 4.1% | 5.7% |
| 2022 | 134.2 | 8.0% | 8.0% |
| 2021 | 124.3 | 4.7% | 3.5% |
| 2020 | 118.7 | 1.2% | 1.9% |
| 2019 | 117.2 | 1.8% | 2.2% |
| 2018 | 115.2 | 2.4% | 2.5% |
| 2017 | 112.4 | 2.1% | 2.3% |
| 2016 | 110.1 | 1.3% | 1.6% |
| 2015 | 108.7 | 0.1% | 1.4% |
United States and other countries
Inflation, consumer prices (annual %) — each country’s latest published year.
- Türkiye 34.9% (2025)
- Russia 8.7% (2025)
- Mexico 3.8% (2025)
- Vietnam 3.3% (2025)
- Japan 3.2% (2025)
- World 3.0% (2025)
- United States 2.9% (2024)
- India 2.4% (2025)
- South Korea 2.1% (2025)
- Saudi Arabia 2.0% (2025)
- France 0.9% (2025)
- China 0.1% (2025)
No published figure yet for Taiwan.
Years can differ between rows: each figure is shown with its own year. The same World Bank indicator for every country.
Latest figure: 2026-09 Data last updated 2026-11-14 · current
Source: The World Bank Group CC BY 4.0; U.S. Bureau of Labor Statistics (BLS.gov), Consumer Price Index Public domain (U.S. government work)
The cumulative change, the average yearly rate and the price comparison are computed by CalculatorLib from these data.
Source details and methodology
- The World Bank Group — World Development Indicators (FP.CPI.TOTL.ZG, FP.CPI.TOTL)
- U.S. Bureau of Labor Statistics (BLS.gov), Consumer Price Index (CUUR0000SA0)