What is the Descriptive Statistics Calculator?
This tool summarizes a dataset with the most common descriptive statistics: count, sum, mean (average), minimum, maximum, range, variance and standard deviation. Just paste a list of numbers and get every key measure at once — handy for homework, lab reports, finance, quality control or quick data checks.
How to use it
Type or paste your numbers into the box, separated by commas or spaces (e.g. 4, 8, 15, 16, 23, 42). Choose Population if your numbers represent the entire group, or Sample if they are a sample drawn from a larger population — this changes whether variance is divided by n or n−1. Click calculate to see all statistics instantly.
The formulas explained
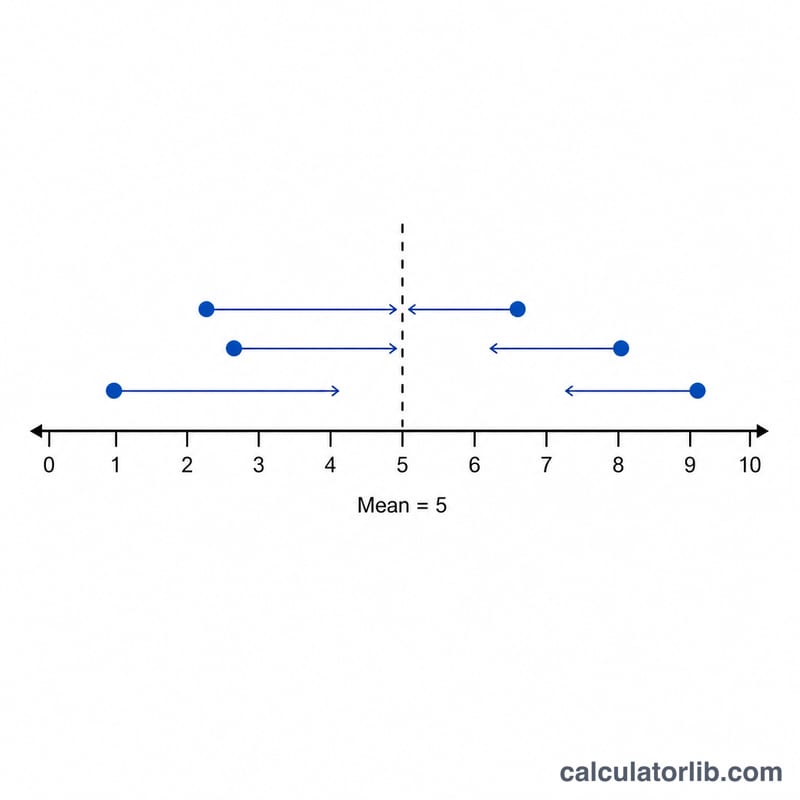
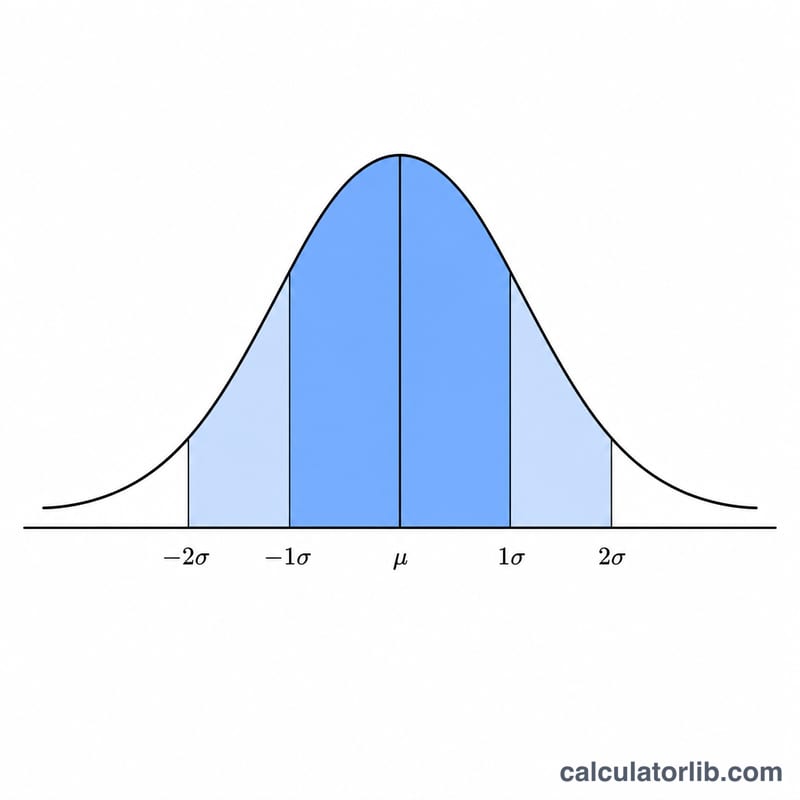
The mean is the sum of all values divided by how many there are: \(\bar{x} = \frac{\sum x}{n}\). Variance measures spread: take each value's distance from the mean, square it, add them up, and divide by n (population) or n−1 (sample): \(\sigma^2 = \frac{\sum (x-\bar{x})^2}{n}\). The standard deviation is simply the square root of the variance, returning the result to the original units:
$$\sigma = \sqrt{\sigma^2}$$
The range is the largest value minus the smallest: range = max − min.
Worked example
For the data set 2, 4, 4, 4, 5, 5, 7, 9: the sum is 40 and \(n = 8\), so the mean is \(40 \div 8 = 5\). The squared deviations sum to 32, so the population variance is \(32 \div 8 = 4\), and the standard deviation is \(\sqrt{4} = 2\). The min is 2, the max is 9, and the range is \(9 - 2 = 7\).
FAQ
Population vs sample — which should I pick? Use population (÷ n) when your data is the complete set. Use sample (÷ n−1) when it is a subset used to estimate a larger population; this gives an unbiased estimate.
What separators can I use? Commas, spaces, semicolons, tabs and new lines all work. Negative numbers and decimals are supported.
Why is the sample standard deviation larger? Dividing by n−1 instead of n produces a slightly bigger value, correcting for the tendency of samples to underestimate population spread.