
What This Calculator Does
This tool estimates your score on the College Board's AP® Statistics exam (a United States Advanced Placement exam) on the standard 1–5 scale. The AP Statistics exam has two equally weighted sections: 40 multiple-choice questions and 6 free-response questions (five short-answer plus one Investigative Task). Enter your raw points and the calculator builds a 100-point composite and maps it to a likely 1–5 score.
How to Use It
Enter the number of multiple-choice questions you answered correctly (0–40). Then enter your earned points on each free-response question. The first five are scored 0–4 each; the sixth Investigative Task is also 0–4 but counts roughly 1.67× as much, matching the official weighting. Click calculate to see your composite and predicted score.
The Formula Explained
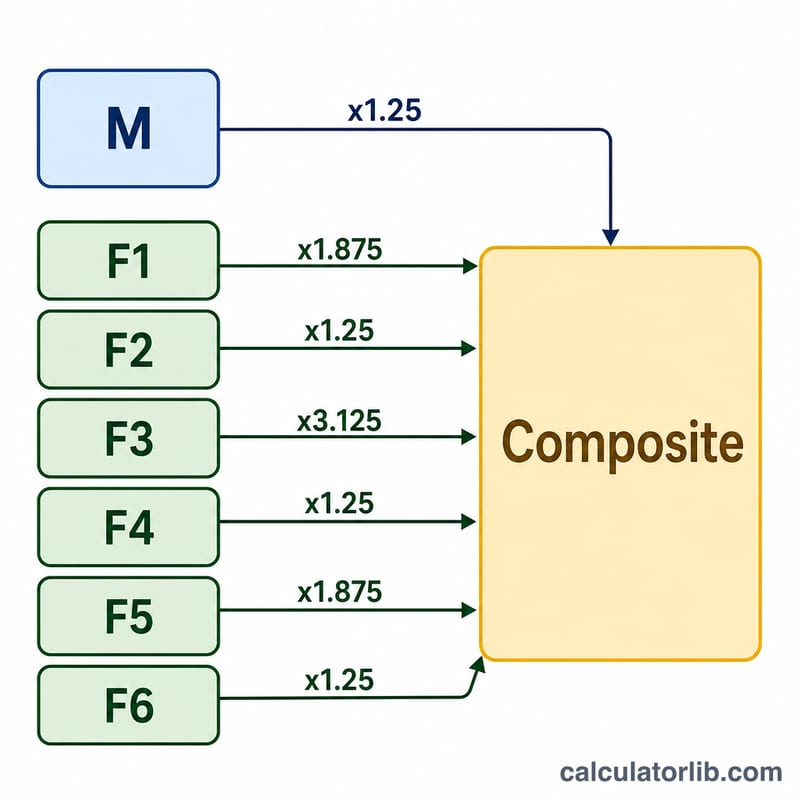
The multiple-choice section is scaled so all 40 correct equals 50 points (each correct = 1.25). The free-response section also totals 50 points: questions 1–5 contribute 1.875 points per rubric point (37.5 max) and the Investigative Task contributes 3.125 per rubric point (12.5 max). Adding both gives a composite out of 100. Typical cut scores are 5 ≥ 68, 4 = 58–67, 3 = 44–57, 2 = 33–43, 1 below 33. Real exam boundaries shift slightly each year, so treat this as an estimate.
$$\text{Composite} = 1.25\,\text{MC} + 1.875\,(F) + 3.125\,\text{FRQ 6}$$
$$\text{where}\quad F = \text{FRQ 1} + \text{FRQ 2} + \text{FRQ 3} + \text{FRQ 4} + \text{FRQ 5}$$
$$\text{AP} = \begin{cases} 5 & \text{Composite} \geq 68 \\ 4 & 58 \leq \text{Composite} < 68 \\ 3 & 44 \leq \text{Composite} < 58 \\ 2 & 33 \leq \text{Composite} < 44 \\ 1 & \text{Composite} < 33 \end{cases}$$
Worked Example
Suppose you get 32 MC correct, and FRQ scores of 4, 4, 3, 3, 2 plus an Investigative Task of 3. \(\text{MC} = 32 \times 1.25 = 40\). FRQ short \(= (4+4+3+3+2) \times 1.875 = 16 \times 1.875 = 30\); task \(= 3 \times 3.125 = 9.375\); \(\text{FRQ} = 39.375\). \(\text{Composite} = 40 + 39.375 = 79.375\) → a predicted 5.
AP Statistics Score Cut-Off Reference Table
The AP® Statistics exam is scored on a 0–100 composite scale that combines the multiple-choice (MC) section and the free-response (FRQ) section. The composite total is then mapped to the familiar 1–5 AP score. The table below shows the typical composite ranges used to set each score level.
| AP Score (1–5) | Approximate Composite Range (0–100) | Qualification |
|---|---|---|
| 5 | 68–100 | Extremely well qualified |
| 4 | 58–67 | Well qualified |
| 3 | 44–57 | Qualified |
| 2 | 33–43 | Possibly qualified |
| 1 | 0–32 | No recommendation |
Note: These boundaries are typical estimates only. The College Board re-sets the exact cut scores every year through a statistical equating process, so the real thresholds shift by a few points from one administration to the next. Use this table as a planning guide, not a guarantee.
What Your AP Statistics Score Means
The College Board reports AP exam results on a 5-point scale, and each number corresponds to an official qualification statement describing how a student would likely perform in the equivalent introductory college course:
- 5 — Extremely well qualified. Performance equivalent to an A in the corresponding college course.
- 4 — Well qualified. Performance equivalent to an A−, B+, or B.
- 3 — Qualified. Performance equivalent to a B−, C+, or C; considered a passing score.
- 2 — Possibly qualified. Below the level most colleges accept for credit.
- 1 — No recommendation. No basis for a credit recommendation.
Most colleges and universities grant course credit or placement for a score of 3 or higher, but policies vary widely by institution and by department. Selective schools often require a 4 or 5, and some grant placement (skipping the intro course) without full credit. Always check the specific AP credit policy of the college you plan to attend before assuming a score will count.
This is general information about score interpretation, not academic placement advice for any particular school.
FAQ
Is this the official score? No. The College Board does not publish exact cut scores; this uses widely cited representative boundaries.
Is there a guessing penalty? No. AP exams have not penalized wrong answers since 2011, so always answer every question.
Why is the Investigative Task weighted more? On the real exam the final FRQ is weighted about 1.67× the other free-response questions because it is more involved.