What this calculator does
This descriptive statistics calculator summarizes a list of numbers into the key measures used in math, science and data analysis: the minimum, maximum, range, count, sum, mean (average), median, mode, variance and standard deviation. Paste numbers from a spreadsheet column or type them by hand and get every summary statistic at once. The tool is purely mathematical and dimensionless, so it works the same everywhere with no country-specific assumptions.
How to use it
Enter your data in the text box, separating values with commas, spaces, tabs or new lines — pasted spreadsheet columns work directly. Choose whether the numbers represent a Sample (a subset drawn from a larger group) or the entire Population. This choice only affects variance and standard deviation: a sample divides the sum of squared deviations by \(n-1\) (Bessel's correction), while a population divides by \(n\). All other statistics are identical for both.
The formulas explained
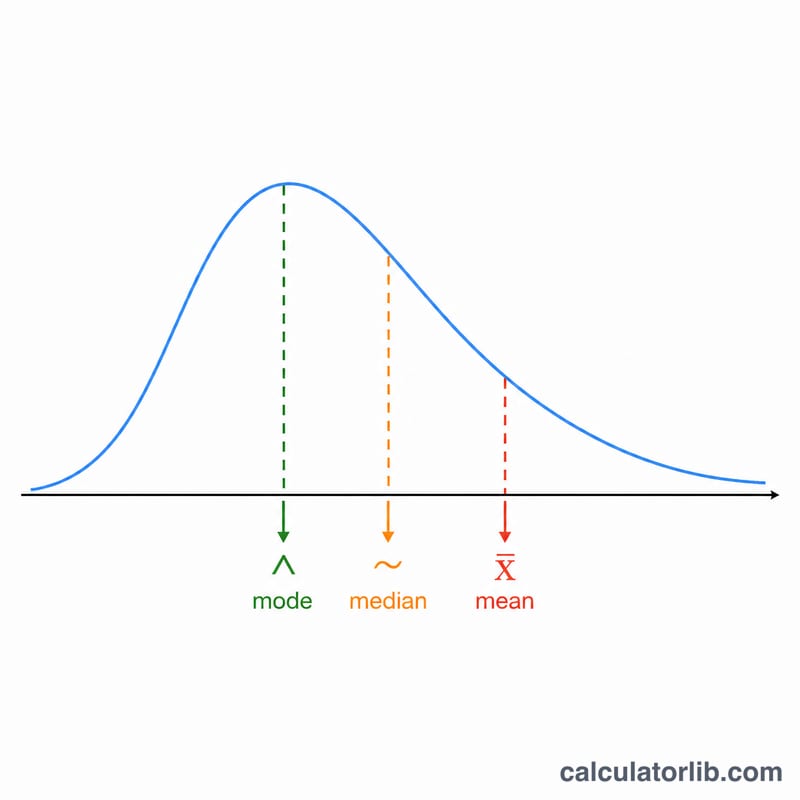
The mean is the sum of all values divided by the count \(n\). The median is the middle value once the data is sorted (or the average of the two middle values for an even count). The mode is the most frequently occurring value; if several tie, the data is multimodal, and if nothing repeats there is no mode. Variance measures spread as the average squared distance from the mean, and standard deviation is its square root, returning to the original units.
$$\bar{x} = \frac{1}{n}\sum_{i=1}^{n} x_i \qquad s^{2} = \frac{1}{n-1}\sum_{i=1}^{n}\left(x_i - \bar{x}\right)^{2} \qquad s = \sqrt{s^{2}}$$$$\mu = \frac{1}{n}\sum_{i=1}^{n} x_i \qquad \sigma^{2} = \frac{1}{n}\sum_{i=1}^{n}\left(x_i - \mu\right)^{2} \qquad \sigma = \sqrt{\sigma^{2}}$$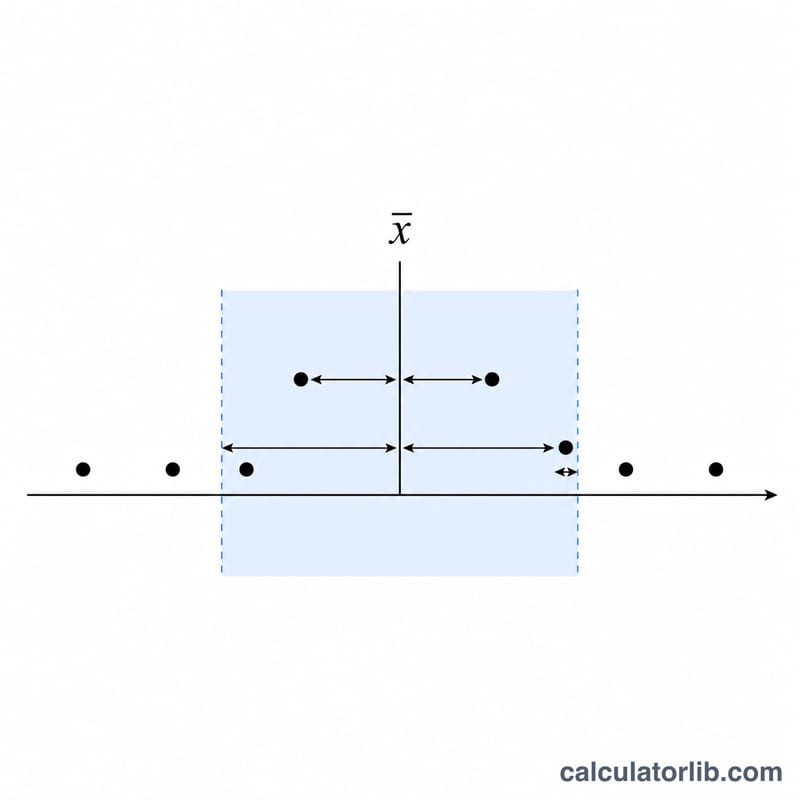
Worked example
For the sample 10, 2, 38, 23, 38, 23, 21: \(n = 7\), \(\min = 2\), \(\max = 38\), \(\text{range} = 36\), \(\text{sum} = 155\), \(\text{mean} = 22.142857\), \(\text{median} = 23\), and modes \(= 23\) and \(38\) (bimodal). The sum of squared deviations is \(1058.857\), so sample variance:
$$s^{2} = \frac{1058.857}{6} = 176.4762 \qquad s = 13.2844$$If treated as a population, variance \(= 151.2653\) and standard deviation \(= 12.2990\).
FAQ
Sample or population — which should I pick? Use Sample when your data is a subset used to estimate a larger group; use Population when you have every member.
Why is standard deviation N/A? A single value gives a sample divisor of \(n-1 = 0\), so sample variance is undefined. Add at least two values.
Can I enter negatives or decimals? Yes — negative numbers, decimals and scientific notation are all accepted, and blank lines or stray separators are ignored.


