What this calculator does
This tool computes the p-th percentile of a list of numbers using the linear interpolation between closest ranks method, also known as the R-7 method. This is the exact same definition used by the PERCENTILE() and PERCENTILE.INC() functions in Excel, Google Sheets and Apple Numbers, so the results match those spreadsheets. It can also print a full percentile table at a chosen step, which conveniently reveals quartiles (step 25) and deciles (step 10).
How to use it
Paste your data in the first box. You can separate the numbers with spaces, commas, new lines, or any mix of them — empty gaps are ignored, so messy lists like 54 65,,, 47,,59, work fine. Enter the percentile you want between 0 and 100. Tick "Display percentile table" and pick a step if you want the value at every Nth percentile listed.
The formula explained
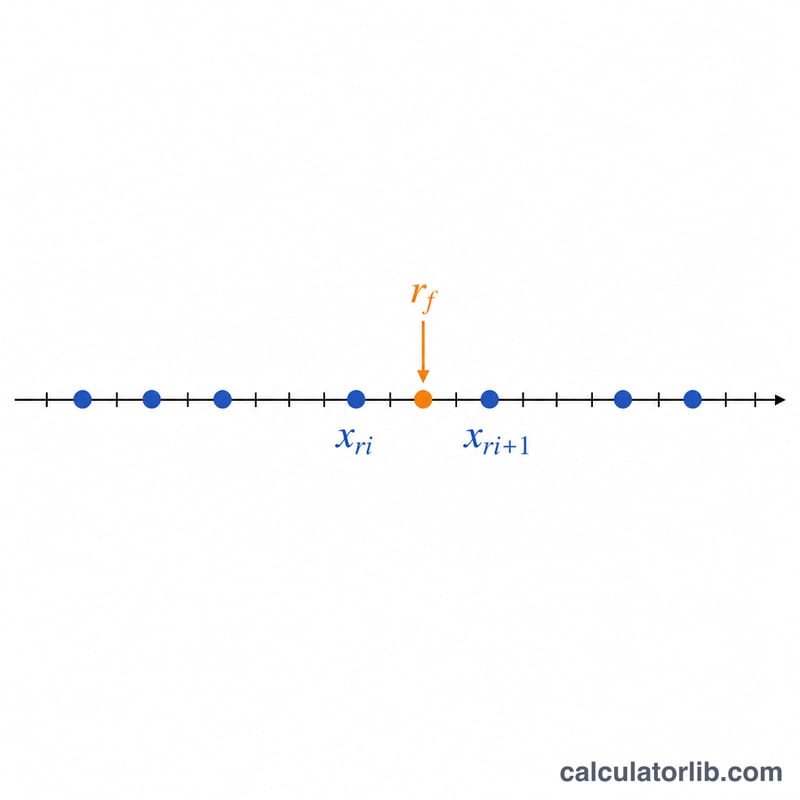
First the data is sorted ascending into \(x_1 \le x_2 \le \ldots \le x_n\). The real-valued rank is \(r = \frac{p}{100}(n-1) + 1\). Split it into an integer part \(r_i = \lfloor r \rfloor\) and fractional part \(r_f = r - r_i\). The percentile is then $$P_k = x_{r_i} + r_f \times \left(x_{r_i+1} - x_{r_i}\right)$$ When \(r_f\) is 0 the answer is exactly \(x_{r_i}\). At \(p = 0\) you get the minimum and at \(p = 100\) the maximum.
Worked example
Data: 42, 54, 65, 47, 59, 40, 53 (\(n = 7\)). Sorted: 40, 42, 47, 53, 54, 59, 65. For the 30th percentile: $$r = 0.30 \times 6 + 1 = 2.8$$ so \(r_i = 2\), \(r_f = 0.8\). Then $$\text{value} = 42 + 0.8 \times (47 - 42) = 42 + 4 = \mathbf{46}$$ The median (\(p = 50\)) gives \(r = 4\), an integer, so the answer is \(x_4 = 53\).
FAQ
Why doesn't this match PERCENTILE.EXC? Excel's PERCENTILE.EXC uses a different (exclusive, R-6) rank formula. This calculator implements the inclusive method, matching the plain PERCENTILE / PERCENTILE.INC functions.
Does input order matter? No. The list is always sorted internally before any computation.
What if I enter only one number? With a single value, every percentile returns that value.


