What is a percentile?
A percentile tells you the value below which a given percentage of observations in a data set fall. The 75th percentile, for example, is the value that separates the lowest 75% of the data from the highest 25%. Percentiles are widely used in standardized testing, growth charts, salary benchmarking, and statistics generally.

How to use this calculator
Enter your numbers separated by commas or spaces, then enter the percentile P you want (a number from 0 to 100). The calculator sorts the data in ascending order, computes the rank position, and interpolates between the two surrounding values to return the percentile value.
The formula explained
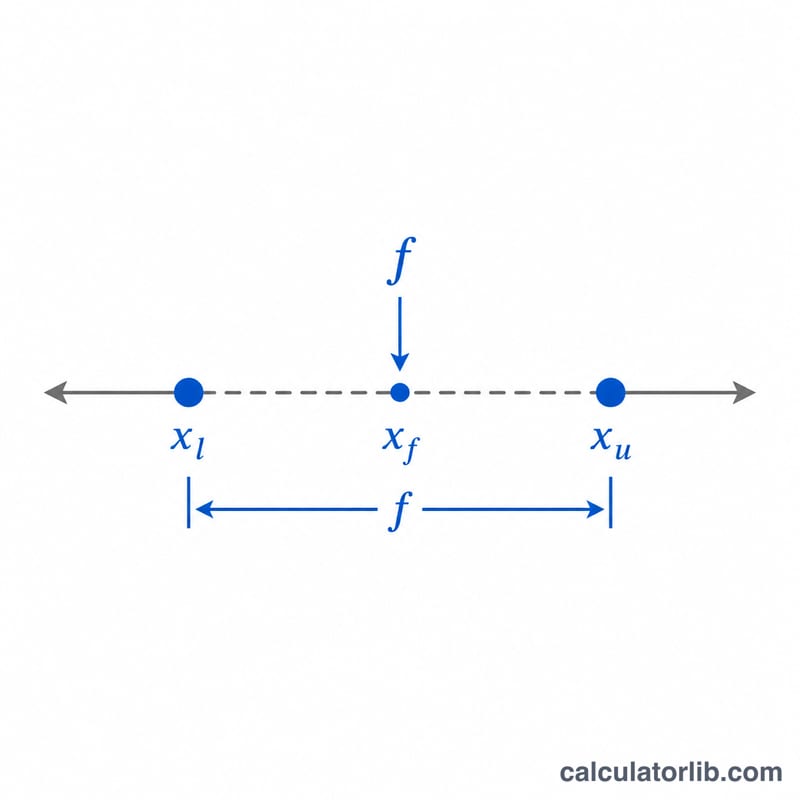
This tool uses the common exclusive (R+1) linear interpolation method. First it finds the rank: $$\text{rank} = \frac{P}{100}\,(n+1)$$ where \(n\) is the number of values. If the rank is not a whole number, it lies between two data points. The integer part gives the lower point's position and the fractional part \(f\) tells you how far to interpolate: $$V = x_{\lfloor\rfloor} + f\,(x_{\lceil\rceil} - x_{\lfloor\rfloor})$$ Ranks at or below 1 return the minimum; ranks at or above \(n\) return the maximum.
Worked example
For the data set 2, 4, 6, 8, 10, 12, 14, 16, 18, 20 (\(n = 10\)) at the 75th percentile: $$\text{rank} = 0.75 \times 11 = 8.25$$ The 8th value is 16 and the 9th value is 18, with fraction 0.25. So $$V = 16 + 0.25 \times (18 - 16) = 16.5$$
FAQ
Why does my answer differ from another tool? There are several percentile definitions. This one uses \((n+1)\) ranking with interpolation; Excel's PERCENTILE.INC uses \((n-1)\) instead, which can give slightly different results.
What if P is 0 or 100? P = 0 returns the smallest value and P = 100 returns the largest value in your data.
Do I need to sort my data first? No — the calculator automatically sorts the numbers for you before computing.