
What Is the Income Percentile Calculator?
This tool estimates where your income falls relative to a population of earners. By comparing your income to a given mean and standard deviation, it returns your percentile rank — the approximate percentage of people who earn less than you. It also shows the "top X%" view and the underlying z-score. The model assumes incomes follow a normal (bell-curve) distribution, which is a simplifying approximation since real income distributions are right-skewed; use it as a quick estimate rather than an official statistic.
How to Use It
Enter three numbers: your annual income, the average (mean) income of the population you want to compare against, and the standard deviation of that population. Click calculate to see your percentile. If you don't know the standard deviation, a common rule of thumb is roughly 50–70% of the mean for national income data.
The Formula Explained
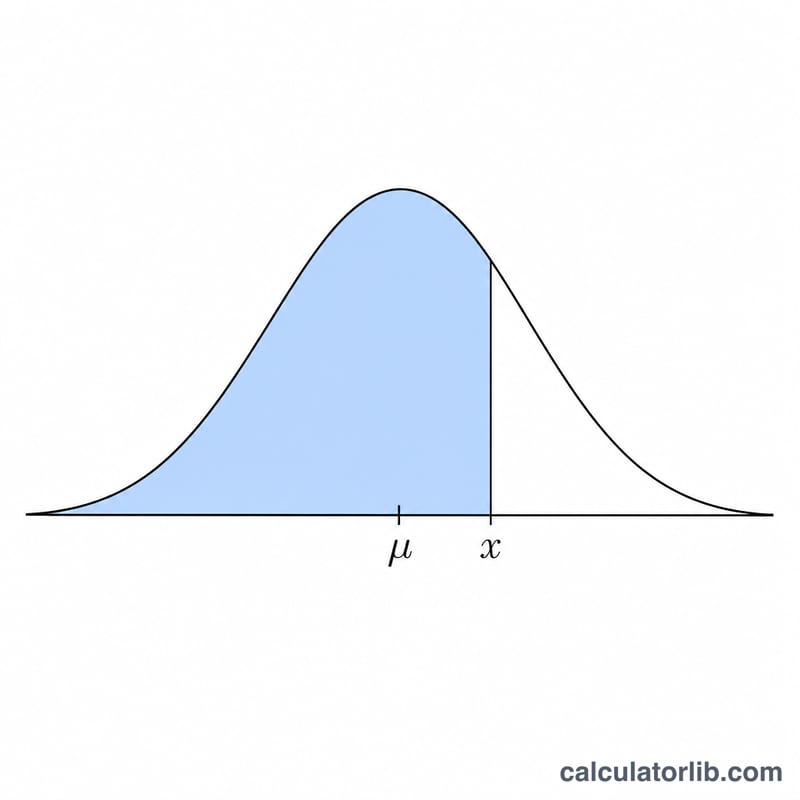
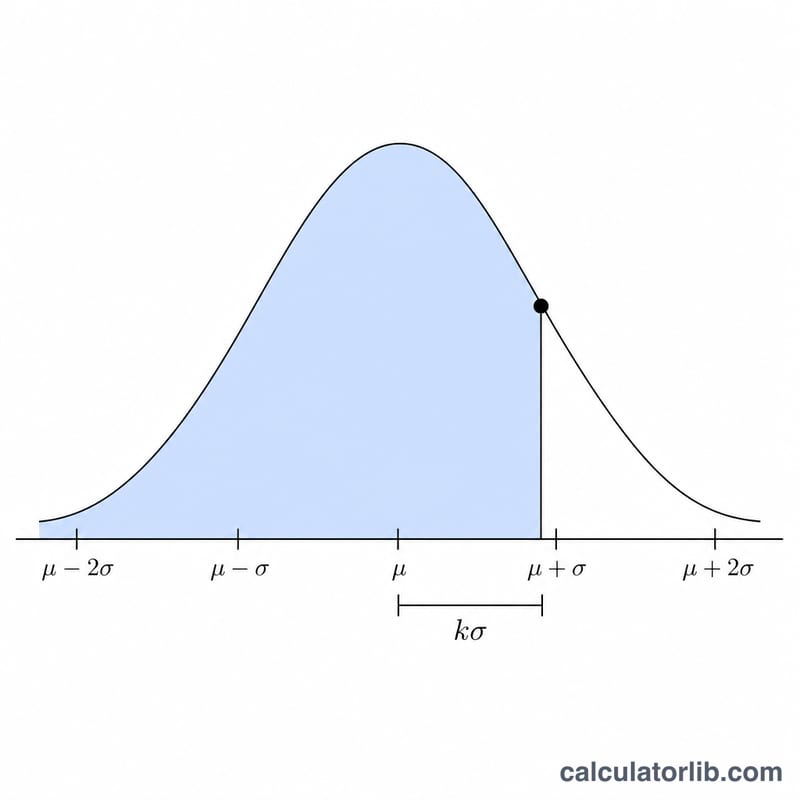
First we compute the z-score, $$z = \frac{x - \mu}{\sigma}$$ which measures how many standard deviations your income sits from the average. We then feed that z-score into the standard normal cumulative distribution function \(\Phi(z)\), which returns the proportion of the distribution below your value. Multiplying by 100 gives the percentile:
$$P = \Phi\left(\frac{x - \mu}{\sigma}\right) \times 100$$This calculator uses the Abramowitz & Stegun polynomial approximation of \(\Phi\), accurate to about \(\pm 7.5 \times 10^{-8}\).
Worked Example
Suppose your income is $75,000, the population mean is $65,000, and the standard deviation is $40,000. The z-score is $$z = \frac{75{,}000 - 65{,}000}{40{,}000} = 0.25$$ Looking up \(\Phi(0.25) \approx 0.5987\), so your percentile is about 59.9 — you out-earn roughly 60% of people and are in the top 40%.
FAQ
Is the normal distribution accurate for income? Not perfectly. Income is right-skewed with a long high-earner tail, so this gives an approximation. For exact figures consult census or tax-agency percentile tables.
What if I get 99+ or 0? Extreme incomes far from the mean push toward the tails of the curve, producing values near 100% or 0%.
Can I use this for any country? Yes — it is jurisdiction-neutral. Just supply the mean and standard deviation for the population you care about.