What Is the Rental Income Calculator?
This calculator helps real estate investors and landlords estimate the profitability of a rental property. It converts your monthly rent and other income into an annual figure, subtracts a vacancy allowance and operating expenses to find Net Operating Income (NOI), then subtracts mortgage payments to reveal your cash flow. It also computes the cap rate when you enter a property value. The tool is currency-neutral but labeled in dollars; the math applies anywhere.
How to Use It
Enter the monthly rent, any other monthly income (parking, laundry, storage), and a vacancy rate to account for periods when the unit sits empty. Add your annual operating expenses — property taxes, insurance, maintenance, management fees, HOA dues, and utilities you pay (but not mortgage principal/interest, which is entered separately). Add the monthly mortgage payment and the property value to see cash flow and cap rate.
The Formula Explained
Gross Annual Income = (Monthly Rent + Other Income) × 12. Vacancy Loss = Gross Income × Vacancy Rate. Effective Gross Income = Gross − Vacancy. NOI = Effective Gross Income − Operating Expenses. Annual Cash Flow = NOI − (Monthly Mortgage × 12). Cap Rate = NOI ÷ Property Value × 100. NOI deliberately excludes financing so you can compare properties on equal footing.
$$\text{NOI} = \text{Effective Income} - \text{Operating Expenses}$$$$\text{Cash Flow} = \text{NOI} - \text{Mortgage}$$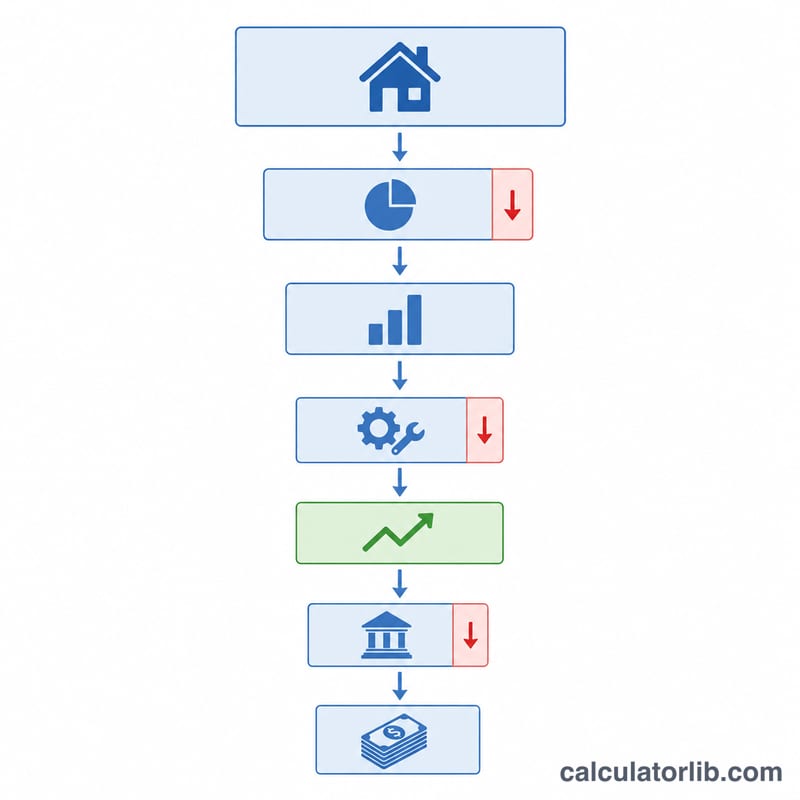
Worked Example
Rent $1,500/mo, no other income, 5% vacancy, $4,000 annual expenses, $800/mo mortgage, $200,000 value. Gross = $18,000. Vacancy = $900. Effective = $17,100. NOI = $17,100 − $4,000 = $13,100. Annual mortgage = $9,600. Cash flow = $13,100 − $9,600 = $3,500/yr (~$291.67/mo). Cap rate = 13,100 / 200,000 = 6.55%.
$$\text{NOI} = \$17{,}100 - \$4{,}000 = \$13{,}100$$$$\text{Cash Flow} = \$13{,}100 - \$9{,}600 = \$3{,}500/\text{yr}$$$$\text{Cap Rate} = \frac{13{,}100}{200{,}000} \times 100 = 6.55\%$$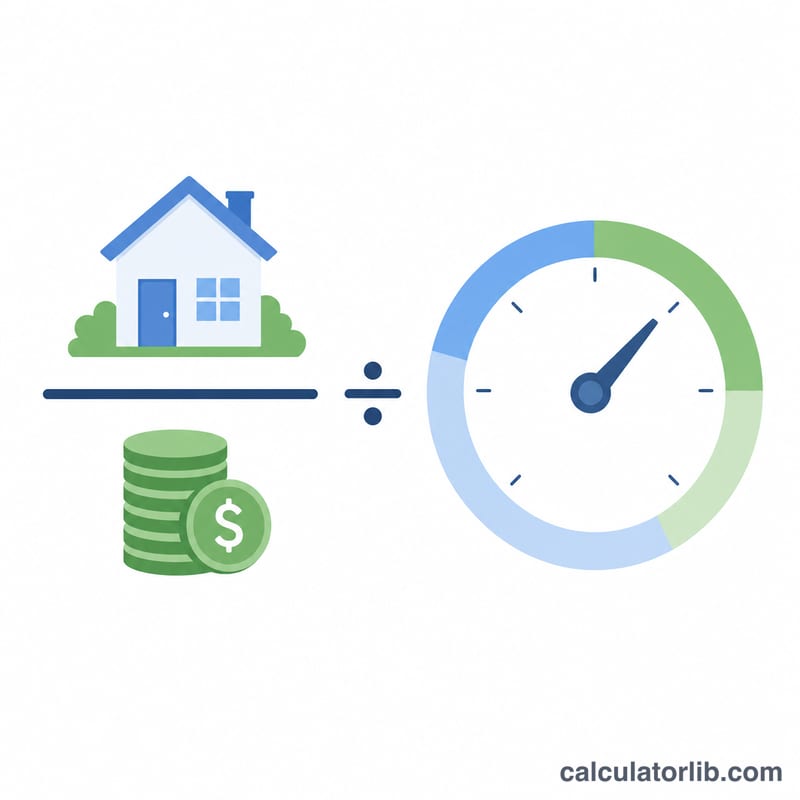
FAQ
Should mortgage be in operating expenses? No. NOI excludes debt service; mortgage is subtracted afterward to get cash flow.
What is a good cap rate? It varies by market, but many investors target 5–10%. Lower-risk areas often have lower cap rates.
Why include a vacancy rate? Units rarely stay rented 100% of the time; 5–8% is a common, conservative assumption.