What This Calculator Does
Evaluate a rental property investment by computing the four key metrics real-estate investors care about: monthly cash flow, cap rate, cash-on-cash return, and net operating income (NOI). Plug in purchase price, financing terms, monthly rent, and operating expenses to see whether the deal cash-flows.
The Four Key Metrics
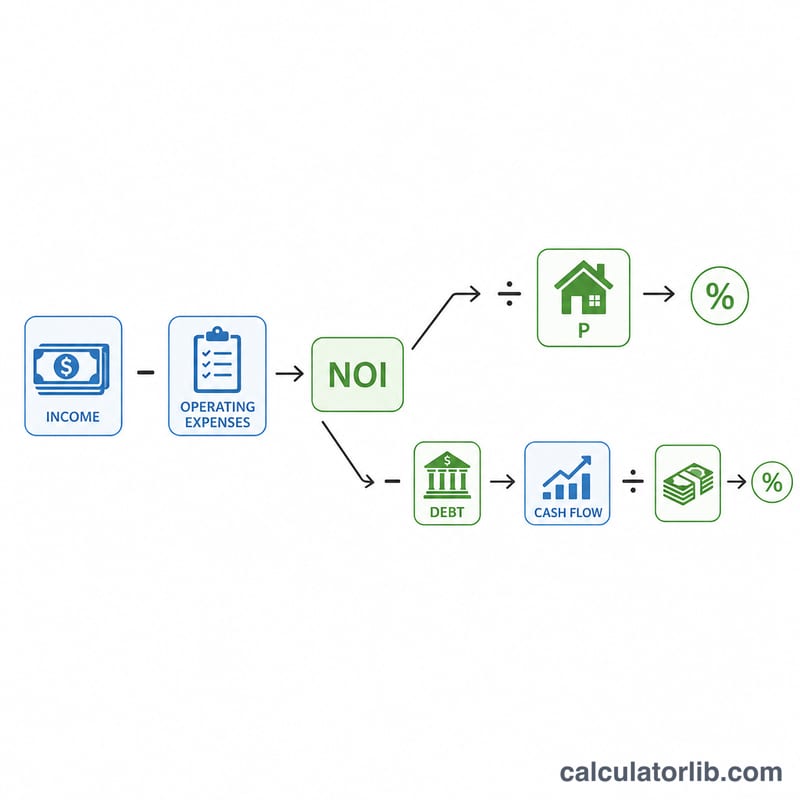
- Net Operating Income (NOI): Effective annual rent (rent \(\times\) (1 − vacancy)) minus all operating expenses (taxes, insurance, HOA, maintenance, management). Excludes mortgage payments — NOI is the property's intrinsic income before financing.
- Cap Rate: NOI \(\div\) purchase price \(\times\) 100. Compares the property's earning yield independent of leverage. Use it to compare across properties.
- Cash Flow: NOI minus annual mortgage payments (principal + interest). The actual cash that lands in your pocket each year.
- Cash-on-Cash Return: annual cash flow \(\div\) down payment \(\times\) 100. Measures the return on your actual cash invested. Higher than cap rate when leverage works in your favor.
Worked Example
$250,000 property, $50,000 down, 7% / 30-year mortgage. Rents for $2,200/month, 5% vacancy, $3,000 taxes, $1,200 insurance, no HOA, 8% maintenance, 8% management:
- Annual gross rent = \(\$2{,}200 \times 12 = \$26{,}400\)
- Effective rent (5% vacancy) = \(\$26{,}400 \times 0.95 = \$25{,}080\)
- Op-ex: taxes $3,000 + insurance $1,200 + maintenance (\(\$26{,}400 \times 0.08 = \$2{,}112\)) + management (\(\$26{,}400 \times 0.08 = \$2{,}112\)) = $8,424
- NOI = \(\$25{,}080 - \$8{,}424 = \$16{,}656\)
- Cap rate = \(\$16{,}656 / \$250{,}000 =\) 6.66%
- Annual mortgage P&I (PMT formula on $200k @ 7% / 30y) \(\approx \$15{,}973\)
- Annual cash flow = \(\$16{,}656 - \$15{,}973 =\) $683
- Cash-on-cash return = \(\$683 / \$50{,}000 =\) 1.37%
This deal barely cash-flows — typical for a high-interest-rate environment. A safer target is 8–12% cash-on-cash for a leveraged buy-and-hold.
Advertisement
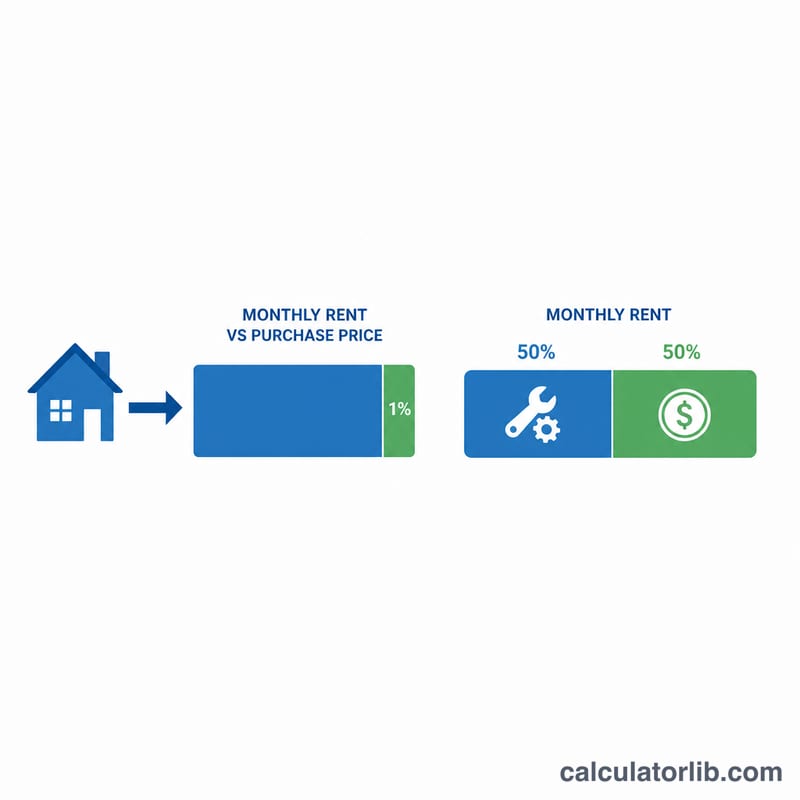
The 1% Rule and 50% Rule
- 1% rule: monthly rent should be at least 1% of purchase price. A $250K property should rent for $2,500+. Hard to meet in 2024+ markets.
- 50% rule: operating expenses (excluding mortgage) tend to run ~50% of gross rent over the long term. If a property's listed expenses look much lower, you're probably underestimating maintenance and capex.
Both are quick screens — not substitutes for line-by-line analysis like this calculator does.
What the Calculator Doesn't Include
- Appreciation. Property values typically rise 3–5%/year long-term, but it's not cash flow — only realized at sale.
- Tax benefits. Mortgage interest, property tax, depreciation, and operating expenses are all deductible against rental income for U.S. landlords. Effective return is usually 1–2% higher after taxes.
- Capital expenditures (CapEx). Roofs, HVAC, water heaters need replacement every 10–20 years. Add 5–10% to maintenance for a sinking fund.
- Closing costs. 2–5% of purchase price at acquisition, plus rehab if applicable. Reduces actual cash-on-cash return until paid back.