
What Is a Mill Rate?
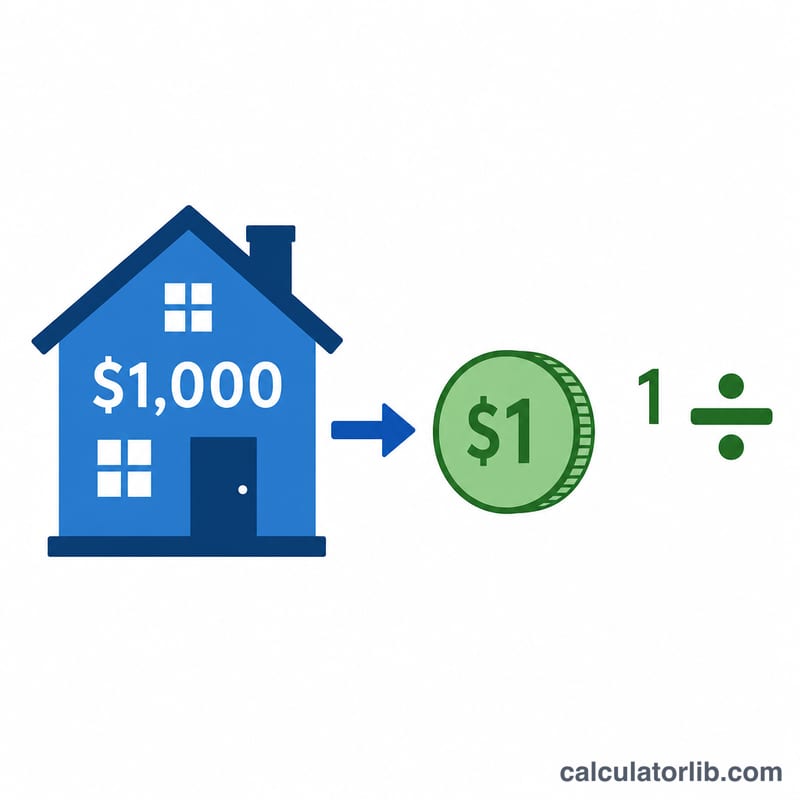
A mill rate (also called millage) is the amount of property tax charged per $1,000 of a property's assessed value. One mill equals one-tenth of a cent, or $1 of tax for every $1,000 of assessed value. Local governments — counties, cities, and school districts — set mill rates each year to fund services such as schools, roads, fire, and police. This calculator works in any jurisdiction that uses the per-$1,000 millage convention; always confirm whether your area taxes the full assessed value or an assessed fraction of market value.
How to Use This Calculator
Enter your property's assessed value (the figure your local assessor places on the property, which may differ from market value) and the combined mill rate from your tax bill or assessor's website. The calculator returns your estimated annual property tax, the effective tax rate as a percentage of assessed value, and an estimated monthly amount for budgeting.
The Formula Explained
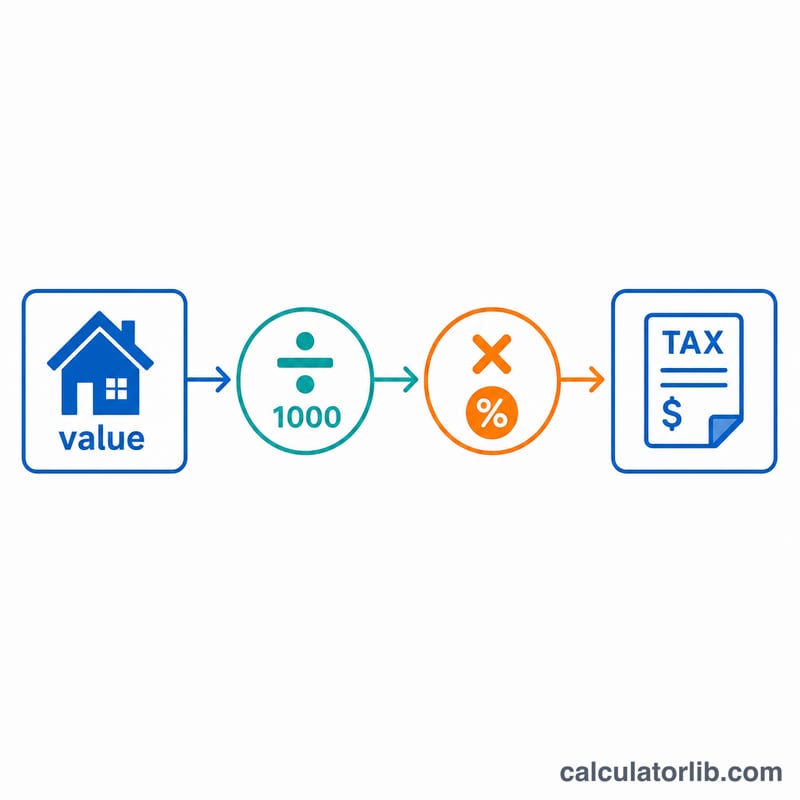
The core equation is $$\text{Tax} = \frac{\text{Assessed Value}}{1{,}000} \times \text{Mill Rate}$$. Dividing by 1,000 converts the value into "thousands," and each mill applies $1 of tax to each of those thousands. The effective rate is simply the tax divided by the assessed value, expressed as a percentage.
Worked Example
Suppose your home is assessed at $250,000 and your combined mill rate is 20 mills. $$\text{Tax} = 250{,}000 \div 1{,}000 \times 20 = 250 \times 20 = \mathbf{\$5{,}000 \text{ per year}}$$ The effective rate is \(5{,}000 \div 250{,}000 \times 100 = 2.0\%\), and the monthly estimate is \(5{,}000 \div 12 \approx \$416.67\).
House prices: how fast they are rising
Official house price indexes for the United States, the United Kingdom and Europe, updated automatically. An index follows the price of comparable homes over time, so the changes compare like with like.
- United States · 1 year
- +2.1%
- United States · 5 years
- +33.4%
- As of
- 2026-Q2
Mortgage rates
What a new home loan costs on average, as banks report it to the European Central Bank. The change over 12 months is computed by CalculatorLib.
- Mortgage rate · Euro area (2026-09)
- 3.62% +0.31 pp since 2025-09
United States: states with the fastest and slowest growth (2026-Q2)
National: +2.1% over 1 year, +33.4% over 5 years.
| State | 1 year | 5 years |
|---|---|---|
| Fastest growth | ||
| Alaska | +8.3% | +37.0% |
| Vermont | +7.2% | +51.8% |
| Hawaii | +5.9% | +39.1% |
| West Virginia | +5.7% | +40.5% |
| Illinois | +5.5% | +43.9% |
| Slowest growth | ||
| New Mexico | −1.2% | +34.6% |
| Washington | −1.0% | +19.6% |
| Colorado | −0.6% | +15.7% |
| California | −0.3% | +17.1% |
| Oregon | +0.2% | +15.7% |
United Kingdom: average price by nation (2026-08)
| Area | Average price | 1 year |
|---|---|---|
| United Kingdom | £273,037 | +0.9% |
| England | £293,525 | +0.4% |
| Scotland | £198,397 | +2.9% |
| Wales | £216,363 | +3.1% |
| London | £554,430 | −2.2% |
Europe: house price change by country (2025)
EU average: +5.5% over 1 year.
| Country | 1 year | 5 years |
|---|---|---|
| Hungary | +18.3% | +105.3% |
| Portugal | +17.6% | +71.0% |
| Bulgaria | +14.6% | +81.4% |
| Croatia | +13.9% | +73.9% |
| Spain | +12.7% | +41.6% |
| Slovakia | +12.4% | +40.8% |
| Czechia | +10.4% | +59.5% |
| Lithuania | +9.8% | +82.8% |
| Netherlands | +8.5% | +49.3% |
| Latvia | +7.6% | +46.8% |
| Ireland | +7.5% | +46.3% |
| Denmark | +7.5% | +25.1% |
| Slovenia | +7.3% | +58.4% |
| Malta | +6.0% | +34.7% |
| Romania | +5.7% | +28.3% |
| Norway | +5.7% | +28.2% |
| Estonia | +5.2% | +66.2% |
| Iceland | +5.1% | +66.7% |
| Poland | +4.9% | +60.2% |
| Cyprus | +4.5% | +28.4% |
| Italy | +4.0% | +15.7% |
| Germany | +3.2% | +10.1% |
| Belgium | +3.2% | +22.7% |
| Austria | +2.5% | +23.3% |
| Luxembourg | +1.6% | +9.3% |
| Sweden | +1.0% | +9.3% |
| France | +0.7% | +9.1% |
| Finland | −2.3% | −6.2% |
Germany: house price change by type of district (2026-Q2)
Destatis publishes this index by type of district, not as one national figure; each change compares with 2025-Q2.
| Type of district | 1 year |
|---|---|
| Metropolises (the 7 largest cities) | −0.4% |
| Other large independent cities | +2.0% |
| Urban districts | +0.5% |
| Rural districts with signs of densification | −1.8% |
| Sparsely populated rural districts | −0.6% |
Latest figure: 2026-Q2 Data last updated 2026-11-02 · current
Source: Federal Housing Finance Agency (FHFA), House Price Index FHFA copyright notice; Contains HM Land Registry data © Crown copyright and database right Open Government Licence v3.0; Eurostat, House price index (prc_hpi_a) Eurostat reuse policy (CC BY 4.0); © Statistisches Bundesamt (Destatis), 2026 Datenlizenz Deutschland – Namensnennung – Version 2.0; European Central Bank, MFI interest rate statistics ECB reuse policy
Percentage changes are computed by CalculatorLib from the published indexes.
Source details and methodology
- Federal Housing Finance Agency (FHFA), House Price Index
- Contains HM Land Registry data © Crown copyright and database right
- Eurostat, House price index (prc_hpi_a)
- © Statistisches Bundesamt (Destatis), 2026 — Häuserpreisindex nach siedlungsstrukturellen Kreistypen
- European Central Bank, MFI interest rate statistics
FAQ
Is the mill rate the same as the tax rate? They describe the same thing differently. A mill rate of 20 equals a tax rate of 2.0% of assessed value (\(20 \div 1{,}000 \times 100\)).
What if my area uses an assessment ratio? Some places tax only a fraction of market value. First multiply market value by the assessment ratio to get assessed value, then enter that number here.
Why is my actual bill different? Exemptions (homestead, senior, veteran), special assessments, and rounding can change the final figure. This tool gives a close estimate before deductions.