
What the Inflation Rate Calculator Does
This calculator measures how much prices have risen between two points in time and converts that change into an average annual inflation rate. Inflation is a universal economic concept (not specific to any one country), so you can use any price index or cost figure — a Consumer Price Index reading, the price of a basket of goods, a salary, or the cost of a single product — as long as both values are measured in the same currency or index.
You enter four things: the Start Year, the Start Value, the End Year, and the End Value. The tool returns the average annual (compound) inflation rate, the total percentage change over the whole period, and the number of years between your two dates.
The Formula Explained
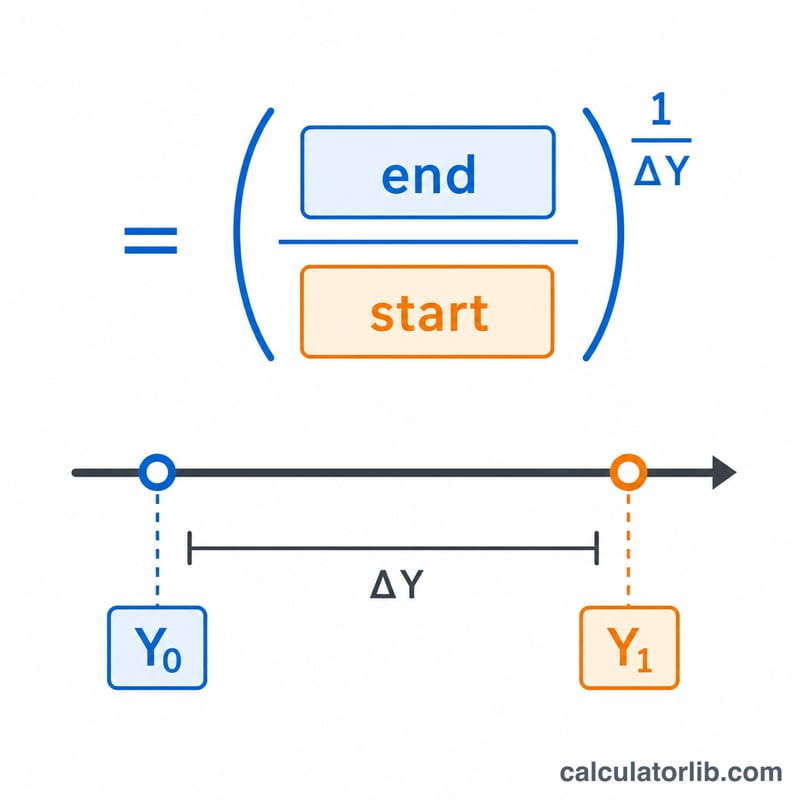
The average annual inflation rate is calculated using the compound growth formula rearranged to solve for the rate:
Average Inflation Rate = ((Pf / Pi)1/n − 1) × 100%
- Pi = the start value (initial price)
- Pf = the end value (final price)
- n = number of years (End Year − Start Year)
The calculator also computes the simple total change = ((End Value − Start Value) / Start Value) × 100%. If the number of years is zero or negative, or if either value is zero or negative, the tool safely returns 0 to avoid invalid maths.
Worked Example
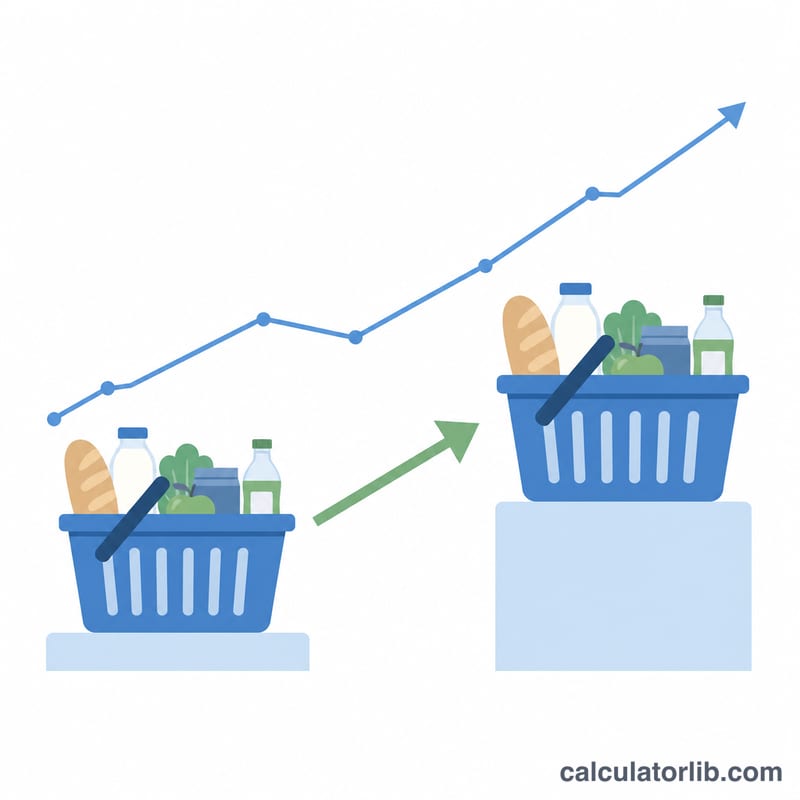
Suppose a basket of goods cost 100 in 2010 (Start Value, Start Year) and 140 in 2020 (End Value, End Year). The number of years is 2020 − 2010 = 10.
- Total change = ((140 − 100) / 100) × 100% = 40%
- Average annual rate = ((140 / 100)1/10 − 1) × 100% = (1.40.1 − 1) × 100% ≈ 3.42% per year
So although prices rose 40% in total, the steady compound rate that produces that result is about 3.42% each year.
Frequently Asked Questions
Why is the annual rate lower than the total change? Because inflation compounds. A 3.42% rise applied year after year builds on the previous year's higher base, so ten years of 3.42% adds up to 40% rather than 34.2%.
Can I use this for deflation? Yes. If your End Value is lower than your Start Value, the result will be negative, indicating that prices fell on average each year.
What data should I enter? Use comparable figures in the same units — typically a published CPI index value for each year, or the actual price of the same item or basket at two different times.