
What This Calculator Does
The Future Inflation Rate Calculator shows how the cost of money grows over time when prices rise at a steady annual rate. Enter a dollar amount today, an expected annual inflation rate, and a number of years, and the tool projects what that same amount will cost in the future. It is useful for anyone planning long-term savings, retirement, education funds, or major purchases, and the dollar sign is just a label — the maths works for any currency.
The Three Inputs
- Present Value ($): the amount of money or cost you are starting with today.
- Annual Inflation Rate (%): the average yearly rate at which prices are expected to increase.
- Time Period (Years): how many whole years into the future you want to project.
The Formula
The calculator uses standard compound growth:
Future Value = Present Value × (1 + Inflation Rate / 100)Years
From that result it also reports three extra figures:
- Total Increase = Future Value − Present Value
- Percentage Increase = (Total Increase ÷ Present Value) × 100
- Average Yearly Increase = Total Increase ÷ Years (a simple dollar average, not a compounded one)
Worked Example
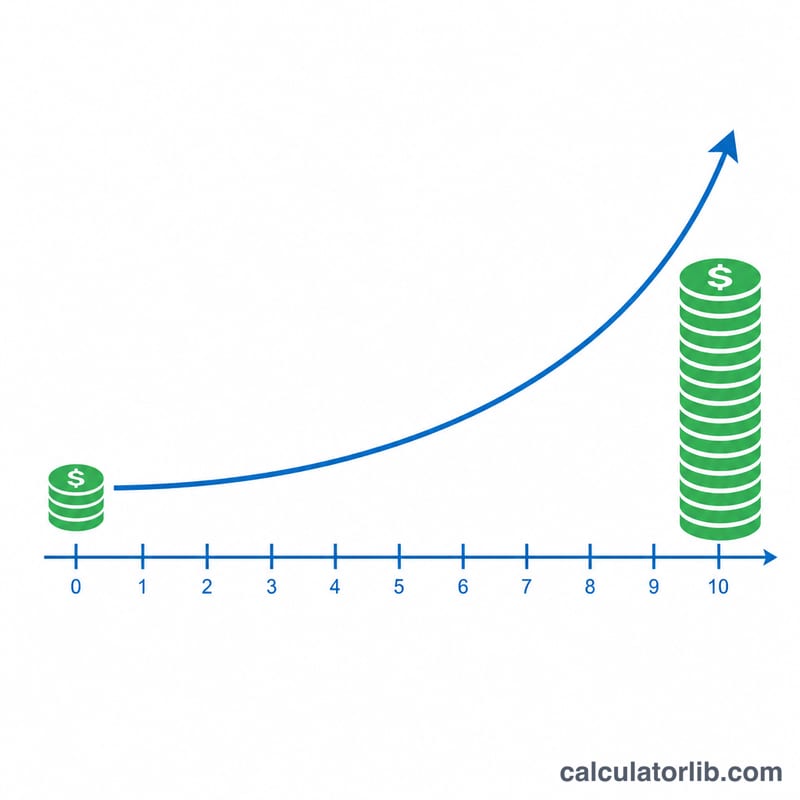
Suppose you enter a Present Value of $10,000, an Annual Inflation Rate of 3%, and a Time Period of 10 years.
- Future Value = 10,000 × (1 + 0.03)10 = 10,000 × 1.3439 = $13,439.16
- Total Increase = 13,439.16 − 10,000 = $3,439.16
- Percentage Increase = (3,439.16 ÷ 10,000) × 100 = 34.39%
- Average Yearly Increase = 3,439.16 ÷ 10 = $343.92 per year
In other words, something costing $10,000 today would cost roughly $13,439 in a decade if inflation averages 3%.
Frequently Asked Questions
Does this show what my money will be worth or what things will cost? It shows the future cost of an item priced at the present value — how much more you would need to pay. To see eroded purchasing power instead, treat the future value as the higher amount required to buy the same goods.
Why does the average yearly increase look smaller than the inflation rate? Because it divides the total increase evenly across the years, ignoring compounding. Compounding stacks growth on growth, so later years add more than earlier ones, while this average is a flat figure.
Can I use decimals or partial years? The rate and present value accept decimals, but the time period is read as a whole number of years, so enter complete years for an accurate projection.