What Is Net Present Value?
Net Present Value (NPV) measures how much value an investment creates after accounting for the time value of money. Because a dollar received in the future is worth less than a dollar today, each future cash flow is discounted back to today using a discount rate. A positive NPV means the project is expected to add value; a negative NPV means it destroys value.
How to Use This Calculator
Enter the discount rate per period (as a percentage), the initial investment paid out today (t=0), and the series of expected future cash flows separated by commas. The first cash flow occurs at t=1, the next at t=2, and so on. The calculator returns the NPV, the present value of the future cash flows, the total undiscounted cash, and the profitability index.
The Formula Explained
NPV equals the negative of the initial outlay plus the sum of each future cash flow divided by (1 + r) raised to its period t. The discount rate \(r\) captures both the risk of the project and the opportunity cost of capital. The profitability index divides the present value of future cash flows by the initial investment, giving the value created per dollar invested.
$$\text{NPV} = -C_0 + \sum_{t=1}^{n} \frac{CF_t}{(1+r)^t}$$$$\text{PI} = \frac{\sum_{t=1}^{n} CF_t/(1+r)^t}{C_0}$$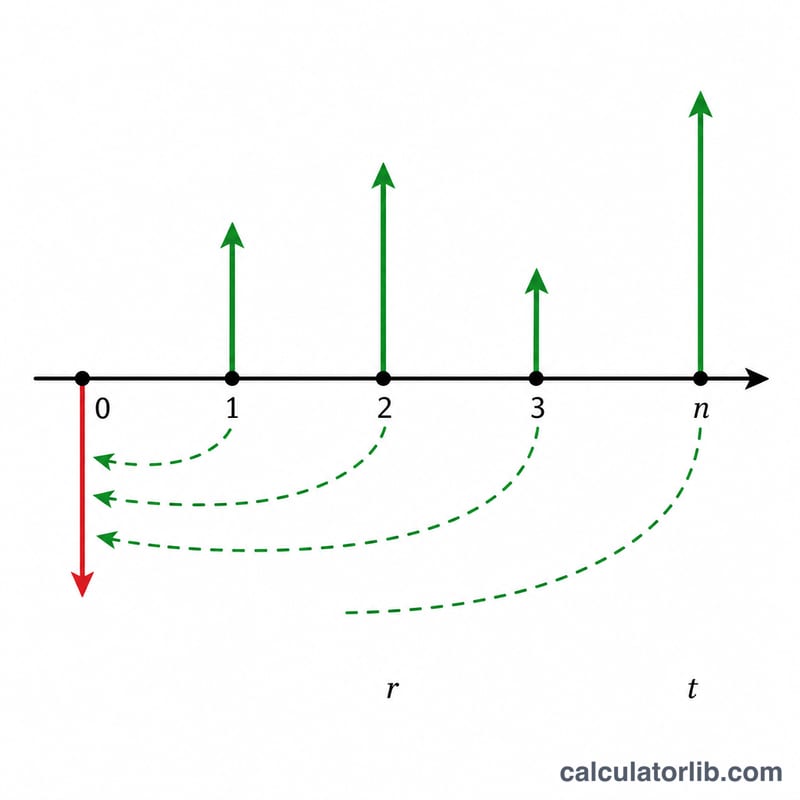
Worked Example
Suppose you invest $1,000 today and receive $300, $400, $500, and $600 over the next four years at a 10% discount rate. Discounting each cash flow gives $$272.73 + 330.58 + 375.66 + 409.81 = 1{,}388.77.$$ Subtracting the $1,000 initial investment yields an NPV of about $388.77, with a profitability index of 1.389 — the project adds value.
Interpreting Your NPV and Profitability Index
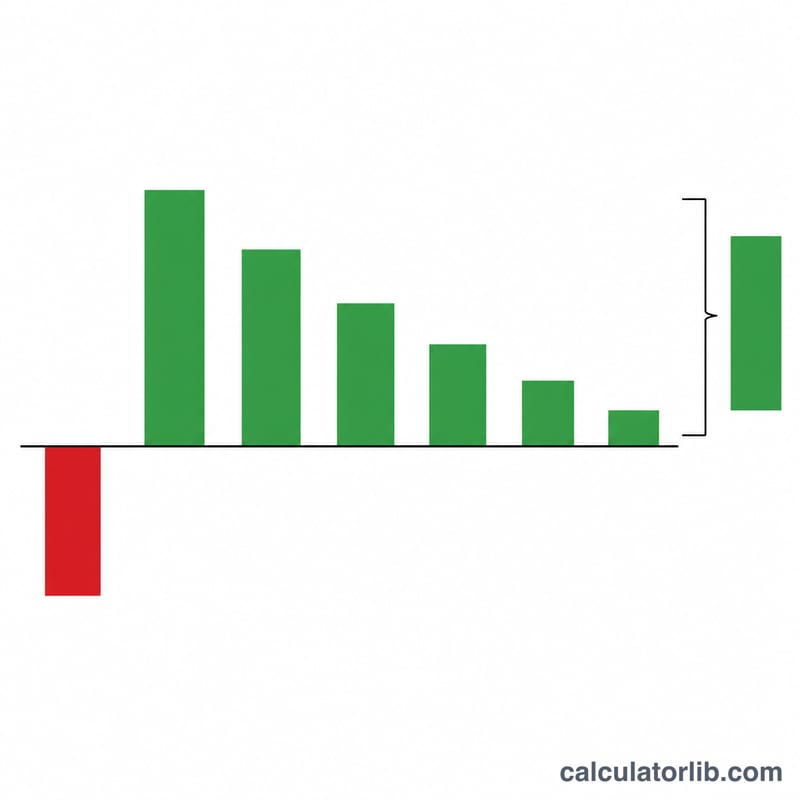
Net present value discounts every future cash flow back to today at your chosen discount rate and subtracts the initial outlay. The sign of the result tells you how the project compares with the return you require.
- NPV > 0: the expected return exceeds the discount rate. The project is expected to create value after covering the required return.
- NPV = 0: the project earns exactly the required return (break-even). It neither adds nor destroys value in present-value terms.
- NPV < 0: the project falls short of the required return and is expected to destroy value at that rate.
The profitability index (PI) is the present value of inflows divided by the initial outlay:
$$\text{PI} = \frac{ \text{PV of future cash flows} }{ \text{Initial investment} } = 1 + \frac{\text{NPV}}{\text{Initial investment}}$$
The decision rule maps directly: PI > 1 corresponds to NPV > 0, PI = 1 to NPV = 0, and PI < 1 to NPV < 0.
Absolute vs. relative. NPV is an absolute measure in currency units, so it shows how much total value a project adds. PI is a relative measure, showing value created per unit invested. This matters when projects differ in size or when capital is rationed: a large project may have the higher NPV, while a smaller one may have the higher PI and make better use of a limited budget. When comparing mutually exclusive projects, NPV is usually the preferred criterion. Under a hard budget limit, PI helps rank projects.
Caveats. The output is only as good as its inputs. Cash flow forecasts are uncertain, and small changes in the discount rate or in the timing of flows can change the result noticeably. The calculator assumes cash flows arrive at the end of each period and does not model taxes, inflation, or risk unless you build them into the inputs. NPV is a modeling output, not personal financial advice.
How Discount Rate Changes NPV
The table uses one example: an initial outlay of $1,000 and end-of-year cash flows of $300, $400, $500 and $600 over four years. Each row applies a different discount rate to the same cash flows. For example, at 10%:
$$\text{PV} = \frac{300}{1.10} + \frac{400}{1.10^{2}} + \frac{500}{1.10^{3}} + \frac{600}{1.10^{4}} = 272.73 + 330.58 + 375.66 + 409.81 = 1{,}388.77$$
so \(\text{NPV} = 1{,}388.77 - 1{,}000 = \)388.77.
| Discount rate | PV of inflows | NPV | PI |
|---|---|---|---|
| 5% | $1,574.07 | $574.07 | 1.574 |
| 8% | $1,458.65 | $458.65 | 1.459 |
| 10% | $1,388.77 | $388.77 | 1.389 |
| 15% | $1,235.14 | $235.14 | 1.235 |
| 20% | $1,106.48 | $106.48 | 1.106 |
| 25% | $997.76 | −$2.24 | 0.998 |
What the table shows. NPV falls steadily as the discount rate rises, because later cash flows are discounted more heavily. The curve crosses zero at the project's internal rate of return (IRR). Here NPV is still positive at 20% and slightly negative at 25%, so the IRR lies just below 25%, at roughly 24.9%. At any required return below that, the project has a positive NPV and a PI above 1. Above it, the NPV is negative and the PI is below 1.
Key Terms and Variables
- Discount rate (r)
- The annual rate used to convert future cash flows into present value. It reflects the return you require given the project's risk. The calculator takes it as a percentage, so enter 10 for 10%.
- Initial outlay (C0)
- The up-front investment made at time zero, entered as a positive number and subtracted in the formula.
- Cash flow (CFt)
- The net cash expected to be received (positive) or paid (negative) at the end of period t. In the calculator these are entered as a list in the cash flows field.
- Period (t)
- The time step, usually a year, in which a cash flow occurs. The first cash flow is at t = 1, and the exponent of the discount factor is t.
- Present value (PV)
- The value today of a future amount: \(\text{PV} = \dfrac{\text{CF}_t}{(1+r)^{t}}\).
- Time value of money
- The principle that money available now is worth more than the same amount later, because it can be invested to earn a return.
- Opportunity cost of capital
- The return you give up by committing funds to this project instead of the best alternative of similar risk. It is often used as the discount rate.
- WACC
- Weighted average cost of capital: the blended cost of a firm's debt and equity financing, weighted by their shares of total capital. Companies commonly use it as the discount rate for average-risk projects.
- Profitability index (PI)
- The present value of future cash flows divided by the initial outlay. A PI above 1 means the project returns more than its cost in present-value terms.
- Internal rate of return (IRR)
- The discount rate at which NPV equals zero. A project is generally acceptable if its IRR exceeds the required return, though IRR can be unreliable for unconventional cash flows or when comparing projects of different scale.
FAQ
What discount rate should I use? A common choice is your weighted average cost of capital or a required rate of return that reflects the project's risk.
Why is the initial investment entered as a positive number? Enter it as a positive amount; the calculator automatically treats it as an outflow at t=0.
What does a profitability index above 1 mean? A PI greater than 1 indicates the present value of future cash flows exceeds the initial investment, signaling a worthwhile project.