
What Is the Least Squares Regression Line?
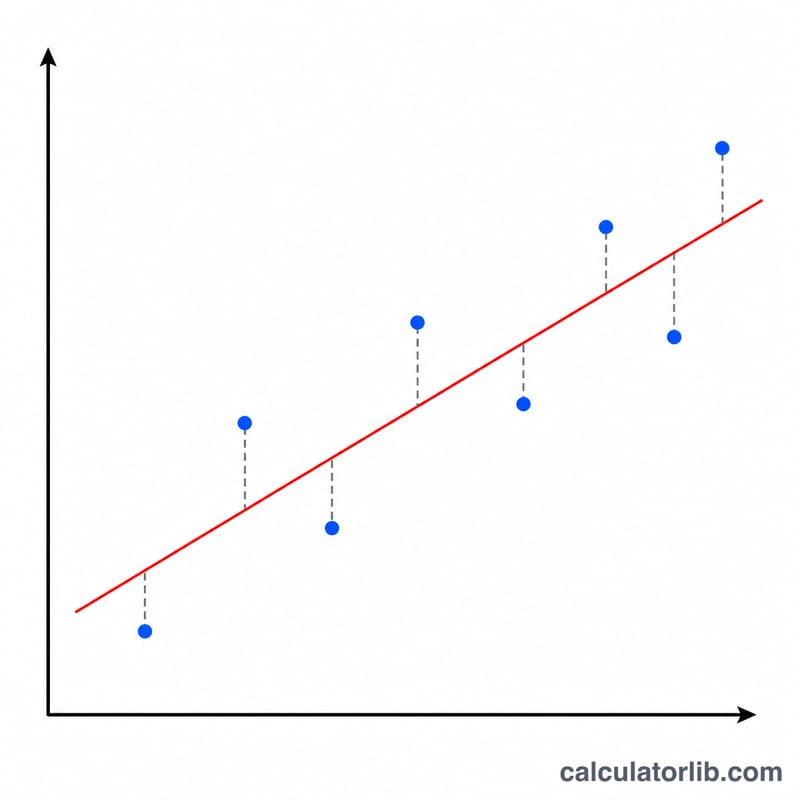
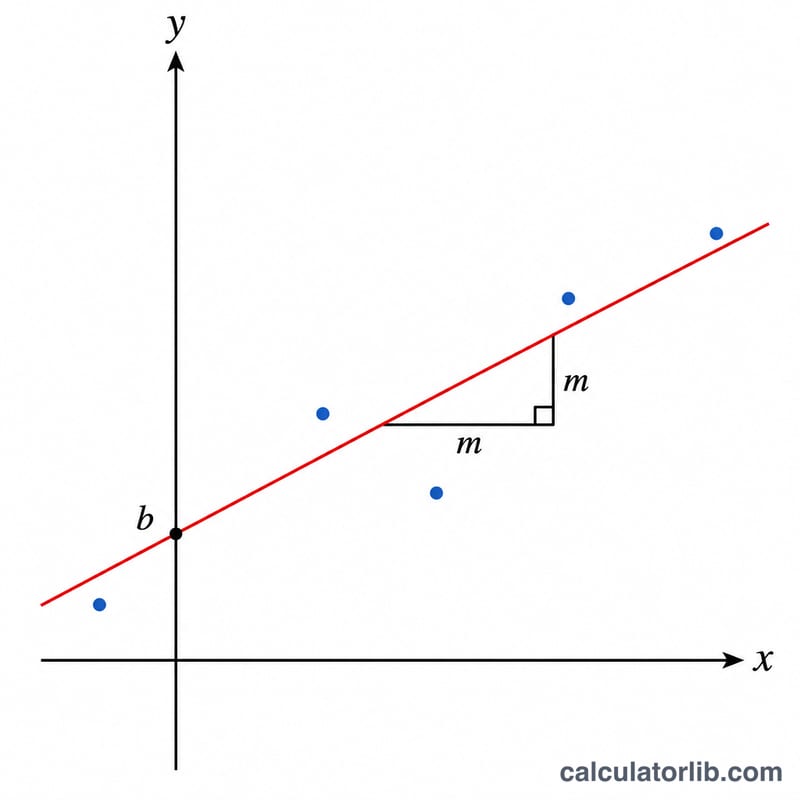
The least squares regression line is the straight line that best fits a set of paired (x, y) data points. "Best fit" means it minimizes the sum of the squared vertical distances between each observed point and the line. The result is an equation of the form \(y = mx + b\), where m is the slope and b is the y-intercept. This is the foundation of linear regression in statistics, used to model relationships and make predictions.
How to Use This Calculator
Enter your X values and Y values as comma-separated lists, making sure each list has the same number of entries and that the order of pairs matches. Click calculate and you'll get the slope, the intercept, the full regression equation, the correlation coefficient (r), and the coefficient of determination (R²). R² near 1 means the line explains most of the variation; near 0 means a weak linear fit.
The Formula Explained
For n data points, the slope is $$m = \frac{n\sum xy - \sum x \sum y}{n\sum x^{2} - \left(\sum x\right)^{2}}$$ Once m is known, the intercept is $$b = \frac{\sum y - m\sum x}{n}$$ Here \(\sum xy\) is the sum of each x times its y, \(\sum x^{2}\) is the sum of squared x values, and \(\sum x\), \(\sum y\) are the simple totals. The denominator measures the spread of the x values; if all x values are identical it is zero and no line can be fit.
Worked Example
Take X = 1, 2, 3, 4, 5 and Y = 2, 4, 5, 4, 5. Then \(n = 5\), \(\sum x = 15\), \(\sum y = 20\), \(\sum xy = 64\), \(\sum x^{2} = 55\). Slope $$m = \frac{5\cdot 64 - 15\cdot 20}{5\cdot 55 - 15^{2}} = \frac{320 - 300}{275 - 225} = \frac{20}{50} = 0.6$$ Intercept $$b = \frac{20 - 0.6\cdot 15}{5} = \frac{20 - 9}{5} = 2.2$$ The best-fit line is $$y = 0.6x + 2.2$$
FAQ
What does R² tell me? R² is the proportion of variance in Y explained by the line, ranging from 0 to 1.
Do X and Y need equal counts? Yes — each x must pair with one y. The calculator uses the shorter list length if they differ.
Can the slope be negative? Absolutely; a negative slope means Y tends to decrease as X increases.