
What is a Two-Proportion Z-Test?
A two-proportion z-test checks whether the difference between two sample proportions is statistically significant. It is the standard tool for A/B tests, comparing conversion rates, response rates, defect rates, or success rates between two independent groups. Under the null hypothesis the two population proportions are equal, so the test pools both samples into a single estimate of the common proportion.
How to Use This Calculator
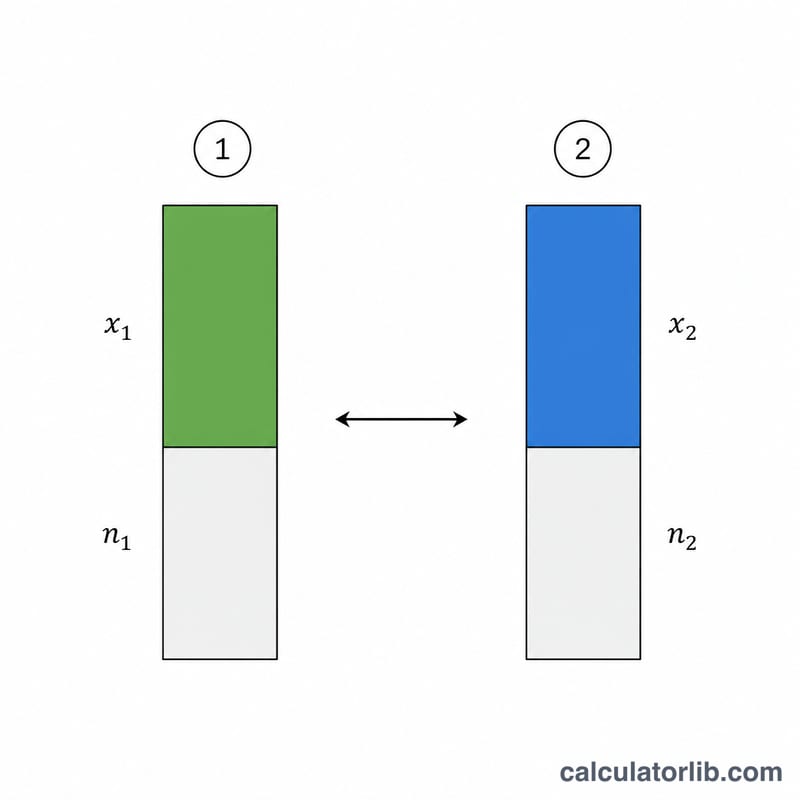
Enter the number of "successes" (e.g. conversions, positive responses) and the total sample size for each of the two groups. The calculator returns the z-statistic, a two-tailed p-value, the individual sample proportions, the pooled proportion, and the standard error. Compare the p-value to your significance level (commonly 0.05): if it is smaller, the difference is statistically significant.
The Formula Explained
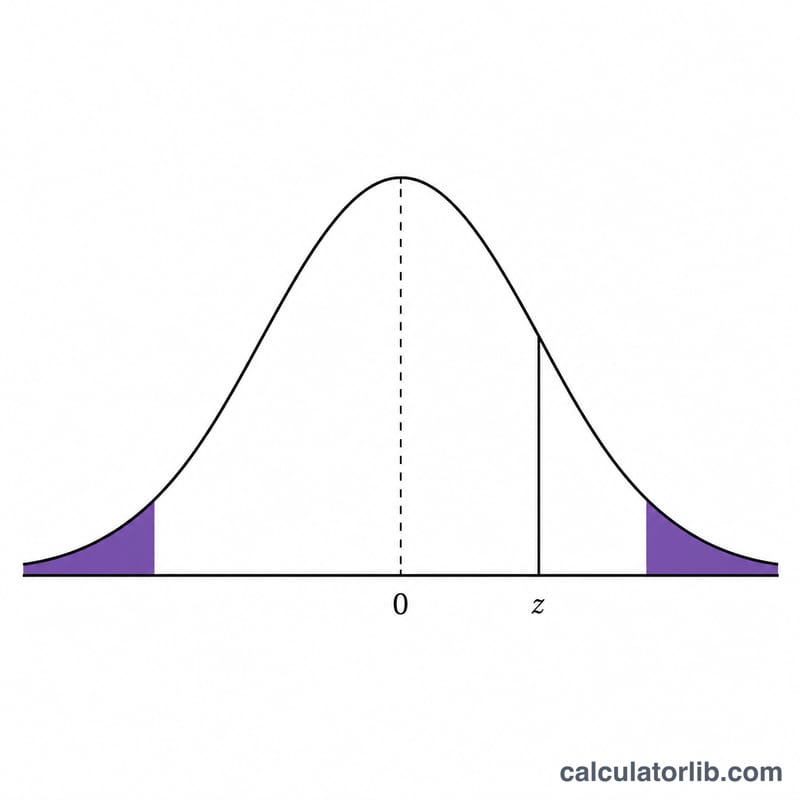
First compute each sample proportion: \(\hat{p}_1 = x_1/n_1\) and \(\hat{p}_2 = x_2/n_2\). Under the null hypothesis the pooled proportion is \(\hat{p} = (x_1 + x_2)/(n_1 + n_2)\). The standard error of the difference is \(\text{SE} = \sqrt{\,\hat{p}(1-\hat{p})(1/n_1 + 1/n_2)\,}\). Finally $$ z = \frac{\hat{p}_1 - \hat{p}_2}{\sqrt{\,\hat{p}\,(1-\hat{p})\left(\frac{1}{n_1}+\frac{1}{n_2}\right)}} $$ The two-tailed p-value is \(2 \times P(Z > |z|)\) from the standard normal distribution.
Worked Example
Suppose Group 1 has 45 successes out of 100 (\(\hat{p}_1 = 0.45\)) and Group 2 has 30 out of 100 (\(\hat{p}_2 = 0.30\)). The pooled proportion is $$ \frac{45+30}{100+100} = 0.375 $$ $$ \text{SE} = \sqrt{0.375 \times 0.625 \times (0.01 + 0.01)} = \sqrt{0.0046875} \approx 0.06847 $$ Then $$ z = \frac{0.45 - 0.30}{0.06847} \approx 2.191 $$ giving a two-tailed p-value \(\approx 0.0285\) — significant at the 5% level.
FAQ
When should I use a pooled vs. unpooled test? The pooled version (used here) assumes equal proportions under the null and is standard for hypothesis testing. The unpooled standard error is typically used for confidence intervals.
What sample size is needed? The normal approximation works well when each group has at least about 5–10 expected successes and failures.
Is the p-value one- or two-tailed? This calculator reports a two-tailed p-value, testing whether the proportions differ in either direction.


