
What Is the Five-Number Summary?
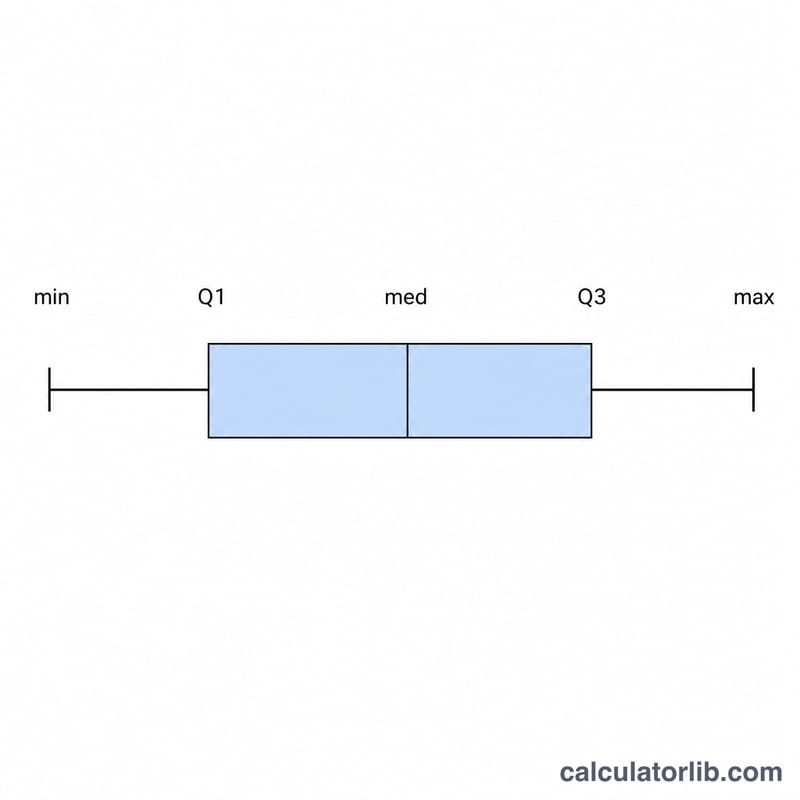
The five-number summary is a concise description of a data set's distribution. It consists of five values: the minimum, the first quartile (Q1), the median (Q2), the third quartile (Q3), and the maximum. Together these numbers reveal the center, spread, and skew of your data and form the basis of a box-and-whisker plot.
How to Use This Calculator
Enter your numbers in the box, separated by commas, spaces, or new lines. The calculator sorts them automatically and returns all five summary values along with the interquartile range (\(\text{IQR} = Q_3 - Q_1\)), which measures the spread of the middle 50% of your data.
The Formula
After sorting the data, the median is the middle value (or the average of the two middle values for an even count). The data is split into a lower half and an upper half. Q1 is the median of the lower half and Q3 is the median of the upper half. When the count is odd, the middle value is excluded from both halves (the exclusive / Tukey method). The IQR is simply \(Q_3 - Q_1\).
$$\begin{gathered} \{\,\text{Min},\ Q_1,\ \text{Median},\ Q_3,\ \text{Max}\,\} \\[1.4em] \text{from sorted}\ \text{Data set} \\[1.2em] \text{where}\quad \left\{ \begin{aligned} \text{Min} &= x_{(1)}, \quad \text{Max} = x_{(n)} \\ \text{Median} &= \operatorname{med}(x_{(1)},\dots,x_{(n)}) \\ Q_1 &= \operatorname{med}(\text{lower half}) \\ Q_3 &= \operatorname{med}(\text{upper half}) \\ \text{IQR} &= Q_3 - Q_1 \end{aligned} \right. \end{gathered}$$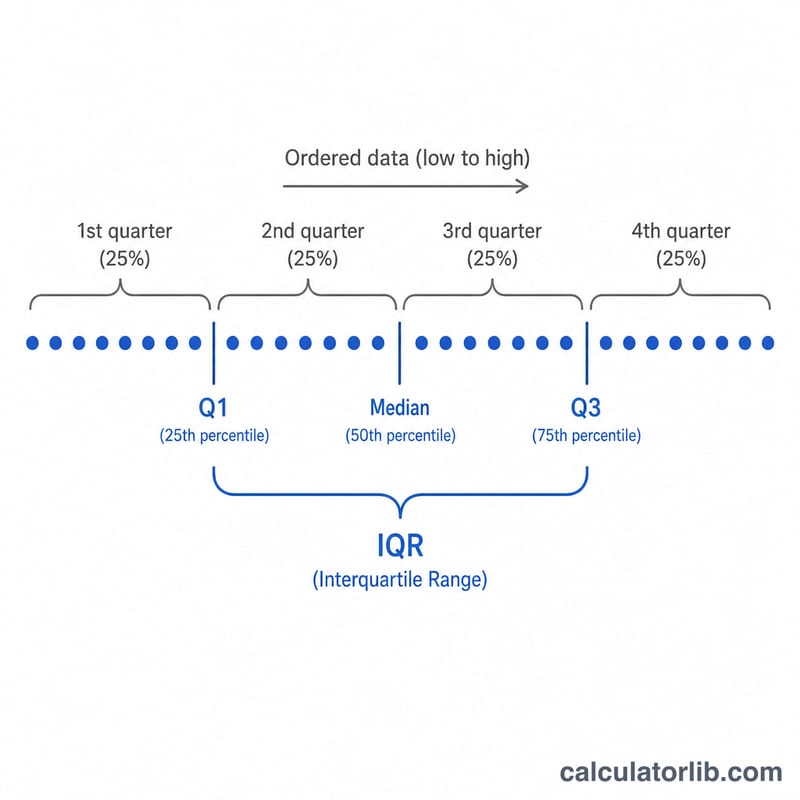
Worked Example
Take the data set 2, 4, 6, 8, 10, 12, 14. Sorted, the minimum is 2 and the maximum is 14. The median is the 4th value, 8. The lower half is {2, 4, 6}, whose median (Q1) is 4. The upper half is {10, 12, 14}, whose median (Q3) is 12. The IQR is
$$\text{IQR} = 12 - 4 = 8$$FAQ
Why are there different quartile methods? Statistics packages use several conventions. This tool uses the common exclusive method, which omits the overall median when splitting an odd-length data set.
What does the IQR tell me? It shows how spread out the central half of your values is and is used to detect outliers (values beyond \(1.5 \times \text{IQR}\) from the quartiles).
How many numbers do I need? You need at least two values, but quartiles become more meaningful with more data points.


