
這個計算器能做什麼
診斷檢測準確度計算器能把一張 2x2 混淆矩陣,換算成流行病學與生物統計常用的各項指標:靈敏度(sensitivity)、特異度(specificity)、偽陰性率(FNR)、偽陽性率(FPR)、陽性預測值(PPV)、陰性預測值(NPV)以及盛行率(prevalence)。這是一個通用工具——背後的數學公式放諸四海皆準,不涉及任何特定國家的規定,無論在臺灣或世界各地,算法都完全相同。
使用方式
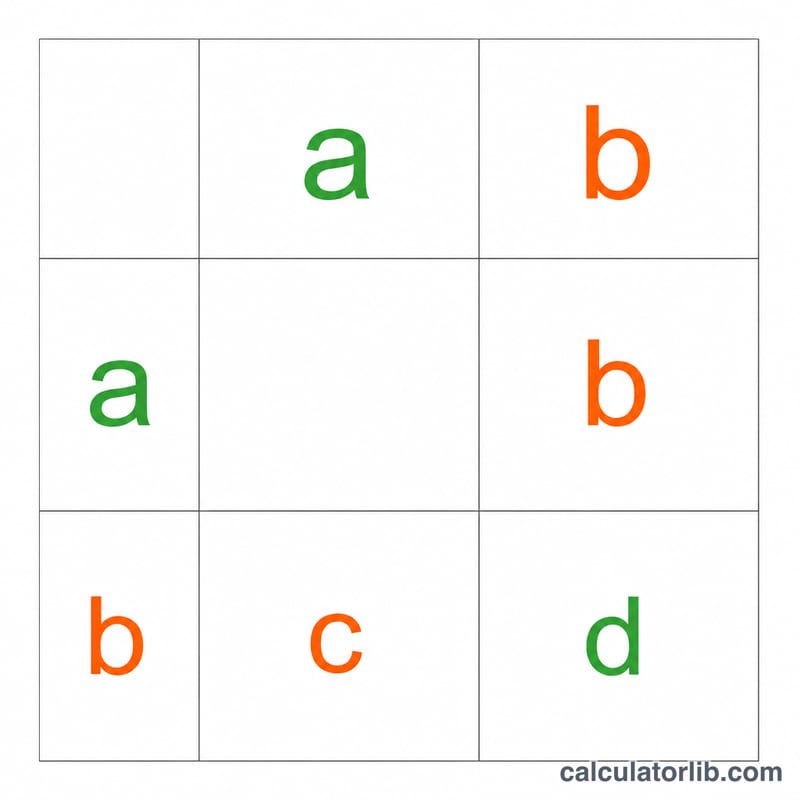
請輸入四個人數:實際患病的總人數、其中檢測結果為陽性的人數、未患病的總人數,以及其中檢測結果為陰性的人數。計算器會由此推導出矩陣的四個欄位:
a(真陽性)=患病且檢測為陽性者;c(偽陰性)=患病總人數減去 a;d(真陰性)=未患病且檢測為陰性者;b(偽陽性)=未患病總人數減去 d。
公式詳解
靈敏度 \(= a / (a + c)\),衡量檢測「找出疾病」的能力。
$$\text{靈敏度} = \frac{a}{a + c}$$特異度 \(= d / (b + d)\),衡量檢測在健康者身上「排除疾病」的能力。
$$\text{特異度} = \frac{d}{b + d}$$偽陰性率 \(\text{FNR} = c / (a + c) = 1 - \text{靈敏度}\);偽陽性率 \(\text{FPR} = b / (b + d) = 1 - \text{特異度}\)。陽性預測值 \(\text{PPV} = a / (a + b)\),代表在檢測結果為陽性時,你真正患病的機率;陰性預測值 \(\text{NPV} = d / (c + d)\),代表在檢測結果為陰性時,你真正健康的機率。盛行率 \(= (a + c) / (a + b + c + d)\),是樣本中患病者所佔的比例,會強烈影響 PPV 與 NPV 的高低。
$$\text{盛行率} = \frac{a + c}{a + b + c + d}$$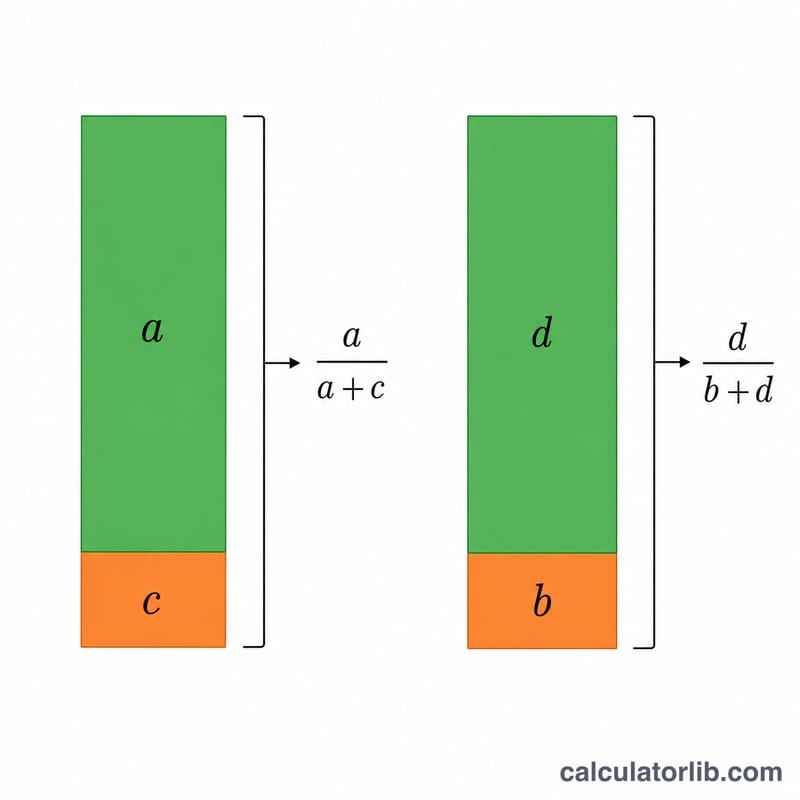
實例試算
假設有 100 名患病者(其中 90 人檢測為陽性),以及 1000 名未患病者(其中 950 人檢測為陰性):\(a = 90\)、\(c = 10\)、\(d = 950\)、\(b = 50\)。
$$\text{靈敏度} = \frac{90}{100} = 0.9000\ (90\%)$$$$\text{特異度} = \frac{950}{1000} = 0.9500\ (95\%)$$$$\text{FNR} = 0.1000$$$$\text{FPR} = 0.0500$$$$\text{PPV} = \frac{90}{140} = 0.6429\ (64.29\%)$$$$\text{NPV} = \frac{950}{960} = 0.9896\ (98.96\%)$$$$\text{盛行率} = \frac{100}{1100} = 0.0909\ (9.09\%)$$常見問題
為什麼這裡的 PPV 遠低於靈敏度?因為這個疾病很罕見(盛行率低),即使偽陽性人數不多,也會超過真陽性人數,把 PPV 拉低。PPV 與 NPV 永遠都會受到盛行率的影響。
FNR 和 FPR 有什麼不同?FNR 是檢測「漏掉」的患病者比例;FPR 則是檢測把健康者「誤判」為陽性的比例。
如果某一類人數是 0 怎麼辦?如果沒有患病者、沒有未患病者、沒有陽性結果或沒有陰性結果,對應的比值在數學上就無法定義,會留白不顯示。