
What this Average Calculator does
This tool takes a list of numbers you type in and instantly returns a full set of summary statistics: the average (mean), the sum, how many numbers you entered (count), the median, the geometric mean, the minimum, the maximum, the range, and the mode. Instead of running each calculation separately, you get all of them from a single input box.
How to use it
There is one input field: numbers. Enter your values separated by commas, spaces, semicolons, or line breaks—the calculator accepts any of these as separators. Negative numbers and decimals are fully supported (for example -4, 12.5, 8). Anything that is not a valid number is simply ignored, so stray text or symbols won't break the result. If no valid numbers are found, the calculator flags the input as invalid.
- Sum – all values added together
- Count – how many valid numbers were detected
- Average (mean) – sum divided by count
- Median – the middle value when sorted
- Min, Max, Range – smallest, largest, and their difference
- Geometric mean & Mode – additional measures of center
The formula
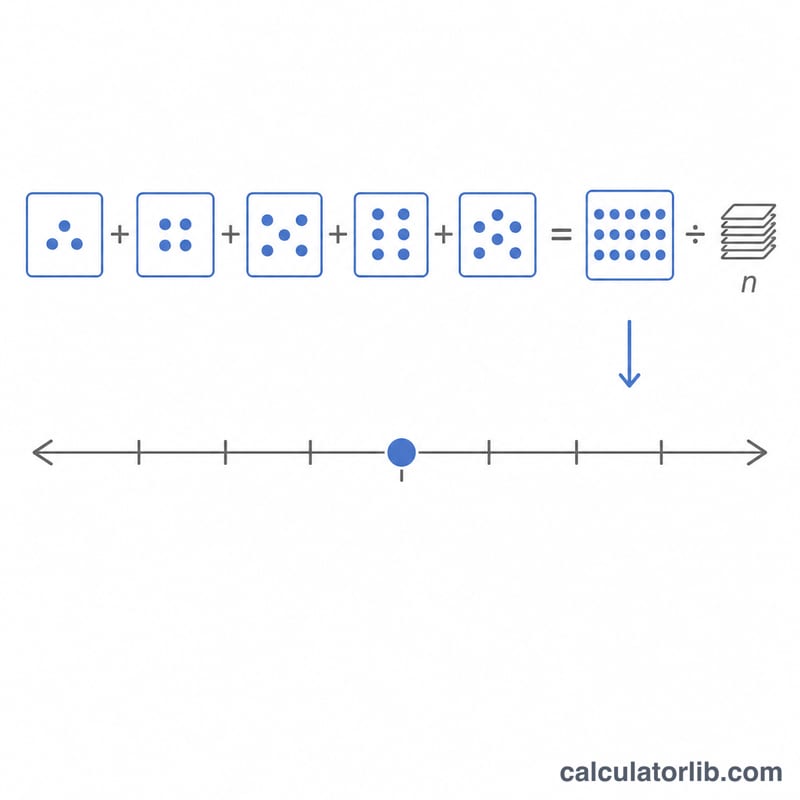
The average is the arithmetic mean:
$$\text{Average} = \frac{1}{n} \times \sum x_i$$
In words: add up all the numbers (\(\sum x_i\)), then divide by the count (\(n\)). The range is calculated as maximum − minimum, and the median is the middle value once the list is sorted (or the average of the two middle values for an even count).
Worked example
Suppose you enter: 4, 8, 15, 16, 23, 42
- Count (\(n\)) = 6
- Sum = \(4 + 8 + 15 + 16 + 23 + 42 = 108\)
- Average = \(108 \div 6 = \mathbf{18}\)
- Median = \((15 + 16) \div 2 = \mathbf{15.5}\)
- Min = 4, Max = 42, Range = \(42 - 4 = \mathbf{38}\)
Definitions & Glossary
These are the central-tendency and spread measures reported by the average calculator. Understanding the difference between them helps you pick the right summary for your data.
- Sum
- The total obtained by adding every value in the dataset together: \(\sum x_i\).
- Count (n)
- The number of values in the dataset. It is the denominator used when computing the mean.
- Mean (arithmetic average)
- The sum divided by the count, \(\bar{x} = \frac{\sum x_i}{n}\). It is the most common "average" and gives equal weight to every value.
- Geometric mean
- The \(n\)th root of the product of all values, \(\left(\prod_{i=1}^{n} x_i\right)^{1/n}\). Unlike the arithmetic mean it multiplies rather than adds, making it suited to growth rates and ratios. It requires positive values and is always less than or equal to the arithmetic mean.
- Median
- The middle value when the data is sorted. With an odd count it is the single central value; with an even count it is the average of the two central values. It is unaffected by extreme outliers.
- Mode
- The value that appears most frequently. A dataset can have one mode, several modes, or none (if every value is unique). Unlike the median, which is about position, the mode is about frequency.
- Range
- The difference between the maximum and minimum values, \(\text{range} = x_{\max} - x_{\min}\). It is the simplest measure of spread.
- Minimum & Maximum
- The smallest and largest values in the dataset, respectively.
Arithmetic vs geometric mean: the arithmetic mean adds values and divides; the geometric mean multiplies values and takes a root. Median vs mode: the median is the positional center of sorted data, while the mode is the most common value — they can be very different numbers.
Interpreting Your Result
Each statistic answers a different question about your numbers. Reading them together gives a fuller picture than any single value.
Mean vs median: which "average" to trust
For roughly symmetric data the mean and median are close, and the mean is a fine summary. When data is skewed or contains outliers, the mean gets pulled toward the extreme values while the median stays near the bulk of the data. For example, in incomes, home prices, or any dataset with a long tail, the median is usually the more representative "typical" value. A large gap between mean and median is itself a signal of skew.
When the geometric mean is appropriate
Use the geometric mean for quantities that compound or are expressed as rates, ratios, or multiplicative factors — investment returns, population growth, price indices, and percentage changes. Because it reflects compounding, it answers "what constant growth factor would give the same end result?" The arithmetic mean of growth rates overstates true average growth, which is why the geometric mean is the correct choice there.
What range and mode reveal
The range is a quick gauge of total spread — how far apart the extremes are — but it only looks at two values and is highly sensitive to a single outlier. For a more robust sense of variability, pair it with the median or a standard-deviation measure. The mode highlights frequency: it tells you the most common outcome, which is especially useful for categorical or repeated data where an "average" makes little sense (for instance, the most common rating or shoe size).
More Worked Examples
Example 1 — Dataset with a repeated value (mode)
Test scores: 7, 8, 8, 9, 10.
- Sum: \(7+8+8+9+10 = 42\)
- Count: \(n = 5\)
- Mean: \(\frac{42}{5} = \) 8.4
- Sorted, the middle value is the 3rd, so the median is 8.
- The value 8 appears twice (more than any other), so the mode is 8.
Here the mean (8.4), median (8) and mode (8) are all close because the data is fairly symmetric, but the mode specifically flags 8 as the most frequent score.
Example 2 — Growth rates (geometric mean)
An investment grows by factors of 1.10, 1.20 and 0.90 over three years (i.e. +10%, +20%, −10%). The correct average growth factor is the geometric mean:
$$\left(1.10 \times 1.20 \times 0.90\right)^{1/3} = \left(1.188\right)^{1/3} \approx 1.0591$$So the equivalent steady growth is about 1.0591 per year (≈ 5.91%). Note the arithmetic mean of the factors, \(\frac{1.10+1.20+0.90}{3} \approx 1.0667\), would overstate the true compounded growth.
Example 3 — Even count with negatives and decimals (median averaging)
Daily temperature changes (°C): −2.5, −1.0, 0.5, 3.0.
- Sum: \(-2.5 + (-1.0) + 0.5 + 3.0 = 0.0\)
- Count: \(n = 4\)
- Mean: \(\frac{0.0}{4} = 0.0\)
- Sorted: −2.5, −1.0, 0.5, 3.0. With an even count, the median is the average of the two middle values: \(\frac{-1.0 + 0.5}{2} = -0.25\)
- Range: \(3.0 - (-2.5) = 5.5\)
This shows how the median of an even-sized set is computed by averaging the two central values, and how negatives and decimals are handled the same way as positive integers.
FAQ
What separators can I use? Commas, spaces, semicolons, and line breaks all work, so you can paste numbers from almost any source.
What's the difference between mean and median? The mean is the sum divided by the count and is sensitive to outliers. The median is the middle value and gives a better sense of the "typical" number when extreme values are present.
Can I use negative numbers and decimals? Yes. The calculator recognises negative numbers, integers, and decimals; invalid entries are skipped automatically.