
What Is Benford's Law?
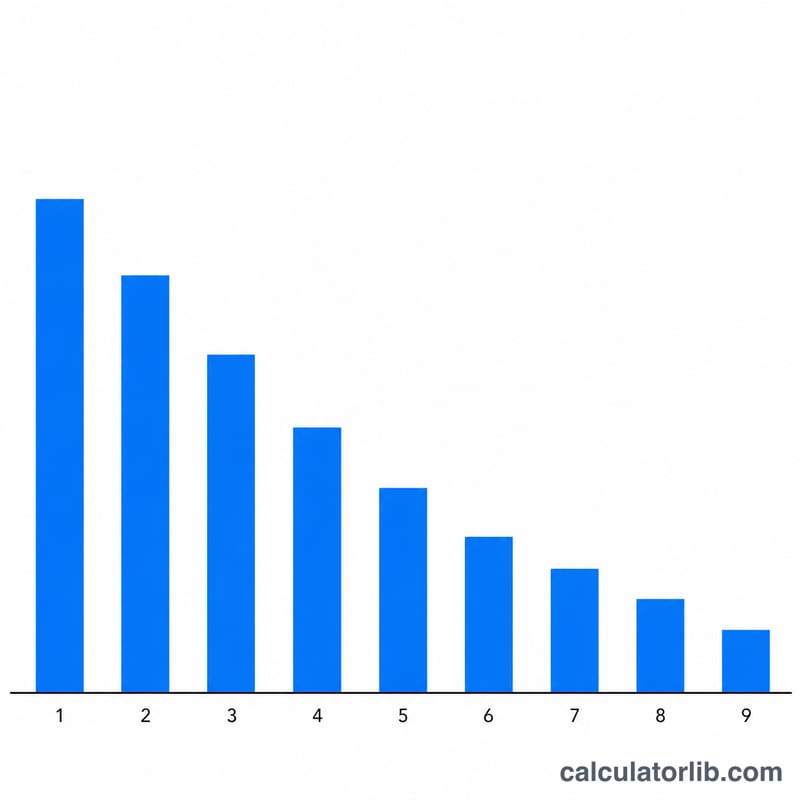
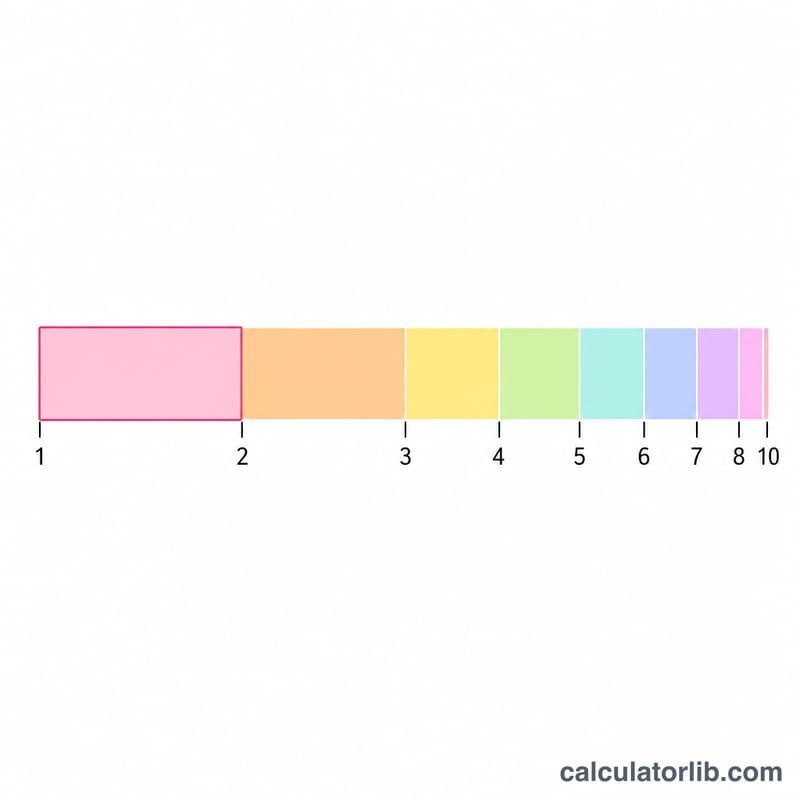
Benford's Law (also called the first-digit law) describes the surprising distribution of leading digits in many real-world datasets — financial figures, population counts, physical constants, and more. Instead of each digit 1–9 appearing equally (about 11.1% each), smaller digits dominate: the digit 1 leads roughly 30.1% of the time, while 9 leads only about 4.6% of the time. This calculator returns the exact Benford probability for any leading digit you choose.
How to Use This Calculator
Select a leading digit from 1 to 9. Optionally enter a sample size (the number of values in your dataset) to see how many entries are expected to begin with that digit if the data follows Benford's Law. The tool outputs the probability as a percentage and a decimal, plus the expected count.
The Formula Explained
The probability of a leading digit d is given by $$P(d) = \log_{10}\!\left(1 + \frac{1}{d}\right)$$ Because the logarithm grows slowly, the gap between consecutive digits shrinks, producing the characteristic downward-sloping distribution. The expected count in a dataset of size N is simply $$E(d) = N \times P(d)$$
Worked Example
For digit 1: $$P(1) = \log_{10}\!\left(1 + \frac{1}{1}\right) = \log_{10}(2) \approx 0.30103$$ or about 30.1%. In a dataset of 1,000 values, you would expect roughly 301 of them to begin with the digit 1. For digit 9: $$P(9) = \log_{10}\!\left(1 + \frac{1}{9}\right) = \log_{10}\!\left(\frac{10}{9}\right) \approx 0.0458$$ or about 4.58% — only about 46 values out of 1,000.
Interpreting Your Result
The calculator returns two numbers for a chosen leading digit \(d\): the Benford probability \(P(d)=\log_{10}\!\left(1+\frac{1}{d}\right)\) and the expected count \(E = N \times P(d)\) for a sample of size \(N\). For example, with \(d=1\) the probability is about 0.30103, so in a dataset of \(N=1000\) values you would expect roughly 301 numbers beginning with the digit 1.
Match versus deviation
When the observed count of a leading digit is close to the expected count \(E\), the data is said to be consistent with Benford's Law. When observed counts depart noticeably from \(E\) across the digits 1–9 — for instance, far too many values starting with 7, 8, or 9, or a near-uniform spread instead of the steep \(P(1) > P(2) > \dots > P(9)\) decline — the dataset is said to deviate from the expected distribution. A single digit being slightly off is usually unremarkable; a systematic pattern across several digits is more meaningful.
The role of goodness-of-fit testing
Eyeballing the gap between observed and expected counts is not enough, because some difference always occurs by chance. A formal goodness-of-fit test — most commonly the chi-square test — quantifies how surprising the overall pattern is. The chi-square statistic sums the standardized squared differences over all nine digits:
$$\chi^2 = \sum_{d=1}^{9} \frac{(O_d - E_d)^2}{E_d}$$
where \(O_d\) is the observed count and \(E_d = N \times P(d)\) is the Benford-expected count for digit \(d\). The resulting statistic is compared against the chi-square distribution with 8 degrees of freedom (nine digits minus one, since the counts must sum to \(N\)) to obtain a p-value. A small p-value indicates the observed leading-digit distribution is unlikely to have arisen if the data truly followed Benford's Law. Related measures such as the mean absolute deviation (MAD) are also used to gauge conformity.
Deviation is a flag, not proof
A statistically significant departure from Benford's Law signals only that the leading-digit pattern is unusual and may warrant further review. It is not evidence of error, manipulation, or fraud on its own. Many ordinary, entirely legitimate processes produce non-Benford distributions, and conversely data can be fabricated yet still conform. Treat a deviation as a prompt to look more closely at how the data was generated, not as a conclusion.
Dataset size and range caveats
Benford's Law is an asymptotic, approximate pattern, and the expected counts \(E_d\) are only meaningful under appropriate conditions:
- Sample size. In small samples the expected counts for higher digits become tiny, the natural sampling variation is large, and the chi-square approximation degrades; results from a few dozen values are unreliable.
- Range and spread. The law fits data that span several orders of magnitude and arise from multiplicative or naturally varied processes. Numbers confined to a narrow range, assigned values (ZIP codes, phone numbers, IDs), capped or rounded figures, or sequences with imposed minimums and maximums need not follow Benford's Law even when nothing is wrong.
- Leading digit only. This calculator addresses the first-digit law; first-two-digit and other extended tests have their own expected probabilities and are often more sensitive.
Because of these caveats, conformity or non-conformity should always be interpreted in light of what the numbers represent and how many of them you have.
FAQ
What kinds of data follow Benford's Law? Data that spans several orders of magnitude and arises from natural growth or multiplicative processes — accounting figures, stock prices, river lengths, and city populations — tend to conform well.
Why is it used in fraud detection? Genuine numerical data often follows Benford's distribution, so significant deviations in financial records can flag fabricated or manipulated numbers for audit.
Does it work for any digit position? This calculator covers the leading (first) digit. Benford's Law also has formulas for second and later digits, where the distribution flattens toward uniform.