What Is Fuel Economy?
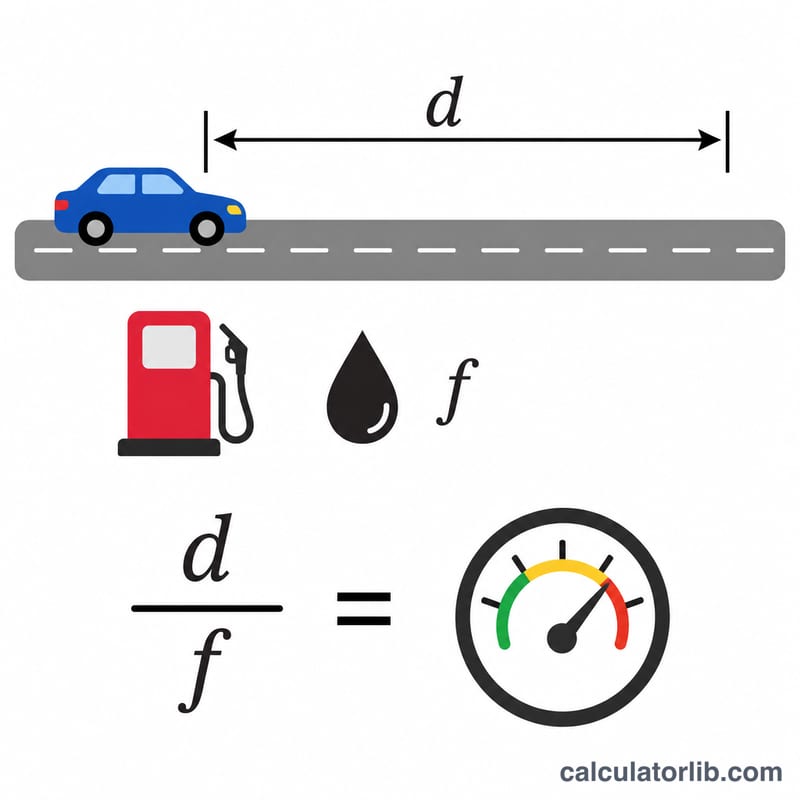
Fuel economy measures how far a vehicle travels on a given amount of fuel. The most common measure in the US is miles per gallon (MPG): the higher the number, the more efficient the vehicle. This calculator turns a simple trip log — the miles you drove and the gallons you burned — into MPG, and also into the metric units L/100km and km/L used in most of the world.
How to Use It
Enter the distance you traveled in miles and the amount of fuel you used in US gallons. The easiest way to gather these numbers is the "full-tank" method: fill the tank, reset the trip odometer, drive, then refill. The miles on the trip meter are your distance, and the gallons it takes to top off the tank are your fuel used.
The Formula Explained
The core formula is $$\text{MPG} = \frac{\text{Distance (miles)}}{\text{Fuel (gallons)}}$$. To convert to liters per 100 kilometers we change gallons to liters (\(\times 3.7854\)) and miles to kilometers (\(\times 1.6093\)), then scale to a 100 km basis. Note that L/100km is an inverse measure — a lower value is better — whereas higher MPG and km/L are better.
Worked Example
Suppose you drove 300 miles and used 12 gallons of gas. $$\text{MPG} = 300 \div 12 = 25 \text{ MPG}$$ In metric terms that is about 9.41 L/100km and roughly 10.63 km/L.
MPG, L/100km and km/L Conversion Table
The table below converts common US MPG (miles per US gallon) values into L/100km (litres per 100 kilometres) and km/L (kilometres per litre). Values are rounded to two decimals.
| MPG (US) | L/100km | km/L |
|---|---|---|
| 10 | 23.52 | 4.25 |
| 15 | 15.68 | 6.38 |
| 20 | 11.76 | 8.50 |
| 25 | 9.41 | 10.63 |
| 30 | 7.84 | 12.75 |
| 35 | 6.72 | 14.88 |
| 40 | 5.88 | 17.01 |
| 50 | 4.70 | 21.26 |
| 60 | 3.92 | 25.51 |
Formulas (US gallons):
$$\text{L/100km} = \frac{235.215}{\text{MPG}} \qquad \text{km/L} = \text{MPG} \times 0.425144$$
Example: driving 300 miles on 10 gallons gives \(300 \div 10 = \)30 MPG. Then \(235.215 \div 30 \approx 7.84\) L/100km and \(30 \times 0.425144 \approx 12.75\) km/L.
Imperial gallons: the UK Imperial gallon is larger than the US gallon, so Imperial MPG figures are higher for the same car. For Imperial MPG use \(\text{L/100km} = 282.481 / \text{MPG}\). For example, 30 Imperial MPG is about 9.42 L/100km, while 30 US MPG is about 7.84 L/100km. Always check which gallon a quoted MPG figure uses.
Note that L/100km is inverse to MPG: a lower L/100km means better efficiency, whereas a higher MPG or km/L means better efficiency.
Typical Fuel Economy Ranges by Vehicle Type
The ranges below are approximate typical combined ratings for recent gasoline and hybrid vehicles in the US market, in US MPG. They are illustrative, not guarantees, and individual models vary widely. Official figures are published by the US EPA at fueleconomy.gov.
| Vehicle class | Approx. combined MPG (US) | Approx. L/100km |
|---|---|---|
| Compact cars | 28–38 | 6.2–8.4 |
| Midsize sedans | 25–35 | 6.7–9.4 |
| SUVs | 20–30 | 7.8–11.8 |
| Pickup trucks | 17–24 | 9.8–13.8 |
| Hybrids | 40–55 | 4.3–5.9 |
About EPA ratings: EPA figures come from standardized laboratory tests and are reported as city, highway and combined values. Real-world results often differ because of driving style, speed, temperature, terrain, tire pressure, cargo and trip length. Your own figure, calculated from distance driven and fuel used over several full tanks, is usually a better guide to your actual consumption. Other regions (such as Europe, which uses WLTP, or Canada) use different test procedures and units, so figures are not directly comparable.
Constants and Conversion Factors Used
| Quantity | Value |
|---|---|
| 1 US gallon | 3.78541 litres |
| 1 Imperial gallon | 4.54609 litres |
| 1 mile | 1.609344 km |
| 1 km | 0.621371 miles |
| MPG (US) to L/100km constant | 235.215 |
| MPG (Imperial) to L/100km constant | 282.481 |
| MPG (US) to km/L factor | 0.425144 |
Where the constants come from:
$$235.215 \approx \frac{100 \times 3.78541}{1.609344} \qquad 282.481 \approx \frac{100 \times 4.54609}{1.609344} \qquad 0.425144 \approx \frac{1.609344}{3.78541}$$
The first uses the US gallon, the second the Imperial gallon, and the third converts US MPG to km/L. This calculator takes distance in miles and fuel in US gallons.
Fuel prices this week: United States
Average retail prices of regular gasoline and diesel across the United States, week of 2026-11-09, taxes included, as published by the U.S. Energy Information Administration. Use them as the fuel price in the calculator above.
- Regular gasoline (2026-11-09)
- $3.995/gal +30.7% since 2025-11-10
- Diesel (2026-11-09)
- $6.127/gal +59.7% since 2025-11-10
World crude oil prices, October 2026
World market prices of crude oil in U.S. dollars per barrel, monthly averages from the World Bank. These are commodity prices, not pump prices: the price at the pump also includes refining, distribution and taxes, and it differs from country to country.
- Crude oil, average of Brent, Dubai and WTI (2026-10)
- $108.50/bbl +72.2% since 2025-10
- Brent (2026-10)
- $125.00/bbl +93.2% since 2025-10
- WTI (2026-10)
- $97.70/bbl +62.3% since 2025-10
- Dubai (2026-10)
- $102.70/bbl +59.7% since 2025-10
Pump prices in the EU, week of 2026-11-09
Pump prices of petrol (Euro-super 95) and diesel by EU country, week of 2026-11-09, taxes included. Use them as the fuel price in the calculator above.
- EU average (petrol)
- 1.877 €/L
| Country | Petrol 95 (€/L) | Diesel (€/L) |
|---|---|---|
| Denmark | 2.391 | 2.435 |
| Netherlands | 2.196 | 2.361 |
| Finland | 2.144 | 2.485 |
| France | 2.088 | 2.178 |
| Germany | 2.067 | 2.253 |
| Greece | 2.042 | 2.099 |
| Italy | 1.995 | 2.218 |
| Ireland | 1.958 | 2.119 |
| Portugal | 1.922 | 2.135 |
| Latvia | 1.846 | 2.083 |
| Romania | 1.844 | 2.033 |
| Belgium | 1.844 | 2.357 |
| Lithuania | 1.843 | 2.225 |
| Estonia | 1.805 | 2.084 |
| Croatia | 1.749 | 2.025 |
| Spain | 1.730 | 1.898 |
| Cyprus | 1.699 | 2.000 |
| Slovakia | 1.691 | 1.965 |
| Hungary | 1.673 | 1.985 |
| Austria | 1.670 | 2.087 |
| Czechia | 1.653 | 1.899 |
| Slovenia | 1.634 | 1.950 |
| Luxembourg | 1.627 | 1.987 |
| Bulgaria | 1.582 | 1.896 |
| Sweden | 1.437 | 1.954 |
| Poland | 1.384 | 1.753 |
| Malta | 1.340 | 1.210 |
Latest figure: 2026-11-09 Data last updated 2026-11-11 · current
Source: U.S. Energy Information Administration (EIA), Gasoline and Diesel Fuel Update Public domain (U.S. government work); World Bank, Commodity Markets (Pink Sheet), modified CC BY 4.0; © European Union, Weekly Oil Bulletin (European Commission) CC BY 4.0
Prices per litre are converted by CalculatorLib from the bulletin's prices per 1,000 litres. Changes over one year are computed by CalculatorLib.
Source details and methodology
- U.S. Energy Information Administration (EIA), Gasoline and Diesel Fuel Update — Weekly retail gasoline and diesel prices
- World Bank, Commodity Markets (Pink Sheet), modified — Commodity Markets (Pink Sheet), monthly prices
- © European Union, Weekly Oil Bulletin (European Commission)
FAQ
Does this use US or Imperial gallons? The calculator assumes US gallons (3.7854 liters). An Imperial gallon is larger (4.546 L), so UK figures would differ.
Why is my MPG lower than the sticker rating? Real-world MPG varies with driving style, traffic, weather, terrain, and load — city driving and high speeds reduce economy.
How can I improve fuel economy? Keep tires properly inflated, remove excess weight, avoid hard acceleration, and maintain steady highway speeds.