
What Is the Miles to Dollars Calculator?
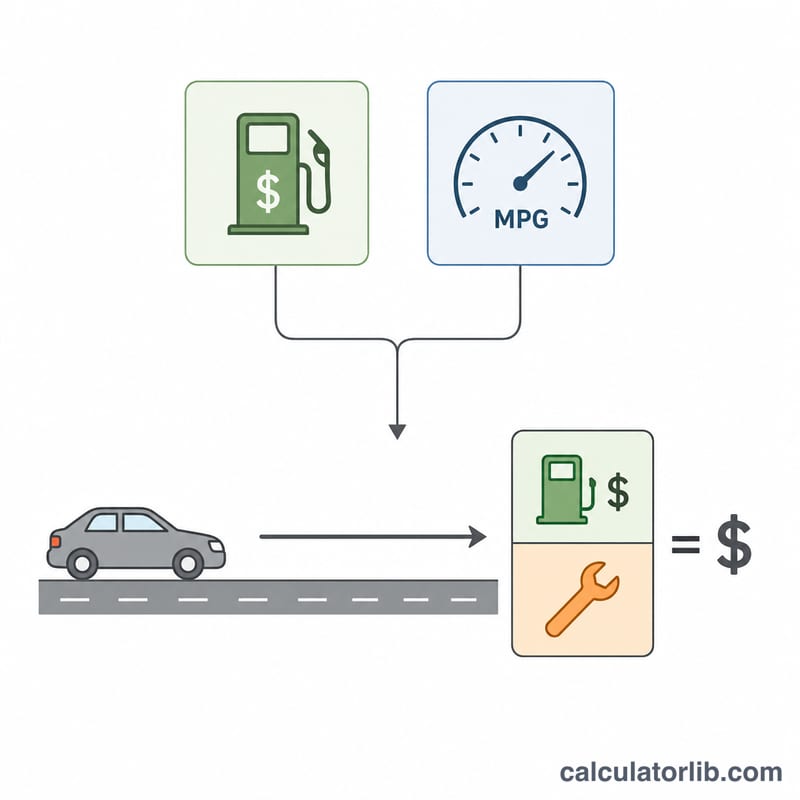
This calculator converts the number of miles you drive into a dollar amount. It estimates the real cost of a trip by combining two things: the fuel you burn (driven by gas price and your vehicle's fuel economy) and a per-mile allowance for maintenance such as tires, oil, and general wear. The result is a clear total cost plus a handy cost-per-mile figure you can reuse for any distance.
How to Use It
Enter the trip distance in miles, the price you pay per gallon of fuel, your vehicle's fuel economy in miles per gallon (MPG), and an optional maintenance cost per mile. Drivers often use the IRS-style estimate of around $0.05–$0.15 per mile for maintenance, but you can set your own. Click calculate to see the total and the breakdown.
The Formula Explained
The core equation is $$\text{cost} = \text{miles} \times \text{cost\_per\_mile}$$ where $$\text{cost\_per\_mile} = \frac{\text{fuel\_price}}{\text{MPG}} + \text{maintenance\_rate}$$ Dividing fuel price by MPG gives the fuel cost of a single mile; adding the maintenance rate accounts for non-fuel wear. Multiplying by total miles scales it to your whole trip.
Worked Example
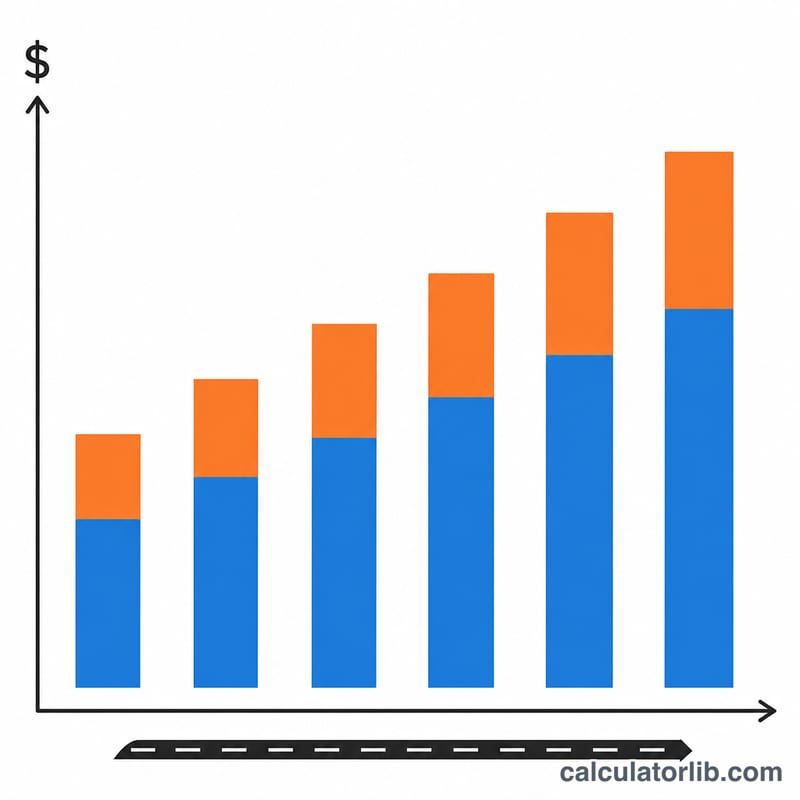
Suppose you drive 100 miles, fuel costs $3.50/gallon, your car gets 25 MPG, and maintenance is $0.10/mile. Fuel per mile = \(3.50 \div 25 = \$0.14\). Cost per mile = \(0.14 + 0.10 = \$0.24\). Total cost = $$100 \times 0.24 = \$24.00$$ made up of $14.00 fuel and $10.00 maintenance.
Driving Cost Across Common Scenarios
Every row below is produced by the same relationship the calculator uses: fuel cost per mile is the pump price divided by fuel economy, and the maintenance allowance is added on top.
$$\text{Cost} = \text{Miles} \times \left( \frac{\text{Fuel Price}}{\text{MPG}} + \text{Maint. Rate} \right)$$
Assumptions used for the whole table: fuel prices are US dollars per US gallon; MPG is the average economy actually achieved over the trip (not the window-sticker figure); the maintenance rate is held fixed at $0.10 per mile for every row so the vehicle and price effects are directly comparable; distances are the total miles driven (a round trip must be entered as twice the one-way distance); no depreciation, insurance, tolls or parking are included.
| Vehicle example | MPG | Fuel price ($/gal) | Fuel cost/mile | Maint. rate | Total cost/mile | 100-mile trip | 1,000-mile trip |
|---|---|---|---|---|---|---|---|
| Hybrid compact | 48 | 3.00 | $0.0625 | $0.10 | $0.1625 | $16.25 | $162.50 |
| Hybrid compact | 48 | 4.50 | $0.0938 | $0.10 | $0.1938 | $19.38 | $193.75 |
| Compact gasoline car | 35 | 3.00 | $0.0857 | $0.10 | $0.1857 | $18.57 | $185.71 |
| Compact gasoline car | 35 | 4.50 | $0.1286 | $0.10 | $0.2286 | $22.86 | $228.57 |
| Midsize sedan | 28 | 3.50 | $0.1250 | $0.10 | $0.2250 | $22.50 | $225.00 |
| Midsize sedan | 28 | 4.50 | $0.1607 | $0.10 | $0.2607 | $26.07 | $260.71 |
| Midsize SUV | 22 | 3.50 | $0.1591 | $0.10 | $0.2591 | $25.91 | $259.09 |
| Midsize SUV | 22 | 4.50 | $0.2045 | $0.10 | $0.3045 | $30.45 | $304.55 |
| Full-size pickup | 16 | 3.50 | $0.2188 | $0.10 | $0.3188 | $31.88 | $318.75 |
| Full-size pickup | 16 | 4.50 | $0.2813 | $0.10 | $0.3813 | $38.13 | $381.25 |
Reproducing one row. Midsize sedan, 28 MPG, $3.50/gal, 1,000 miles:
$$\text{Cost} = 1000 \times \left( \frac{\$3.50}{28} + \$0.10 \right) = 1000 \times \left( \$0.125 + \$0.10 \right) = 1000 \times \$0.225 = \$225.00$$
Two patterns are worth noting. First, doubling fuel economy halves only the fuel term, not the whole figure: at $4.50/gal the hybrid's fuel cost per mile is a third of the pickup's ($0.0938 vs $0.2813), but the total cost per mile is about half ($0.1938 vs $0.3813), because the $0.10 wear allowance is identical for both. Second, the gap between vehicles widens with price: at $3.50/gal the pickup costs about $0.09/mile more than the sedan; at $4.50/gal that gap grows to about $0.12/mile, or roughly $120 over 1,000 miles.
Fuel prices and the US gallon are used here only as an illustration. If you buy fuel by the litre, enter price per litre together with miles per litre (or convert both to a consistent pair of units) — the formula is unit-agnostic as long as the price unit and the economy unit match.
IRS Standard Mileage Rates and Typical Per-Mile Costs
The rates in this section are United States figures. The standard mileage rate is set by the US Internal Revenue Service for US federal income tax purposes, and the driving-cost data below comes from AAA, a US motoring association. They do not apply to other countries, which publish their own approved mileage rates (for example HMRC in the UK or the CRA in Canada) at different values.
IRS standard mileage rates (cents per mile)
| Tax year | Business use | Medical, and moving for qualified Armed Forces members | Charitable use |
|---|---|---|---|
| 2023 | 65.5¢ | 22¢ | 14¢ |
| 2024 | 67¢ | 21¢ | 14¢ |
| 2025 | 70¢ | 21¢ | 14¢ |
Source: IRS annual standard mileage rate notices (one is issued for each tax year, normally in December of the preceding year). The business and medical rates are revised every year, and in unusual years the IRS has changed the rate mid-year — in 2022 the business rate was 58.5¢ for January–June and 62.5¢ for July–December. The charitable rate of 14¢ is fixed in statute rather than recalculated, which is why it has not moved for decades. For any year after those listed, check the current IRS notice at irs.gov before relying on a figure; do not extrapolate the trend.
The business rate is a composite, not a fuel rate. The IRS derives it from an annual study of the fixed and variable costs of operating an automobile: fuel, oil, maintenance and repairs, tires, depreciation, insurance, license and registration. That is why 70¢ per mile in 2025 is several times the pure fuel cost of a typical car — at $3.50/gal and 28 MPG, fuel alone is about 12.5¢ per mile. The medical and moving rate, by contrast, is based on variable costs only, which is the main reason it is so much lower than the business rate.
Typical per-mile cost components (US, published driving-cost studies)
| Cost component | Typical figure | Basis |
|---|---|---|
| Maintenance, repair and tires | roughly 9–11¢ per mile for an average new vehicle | AAA Your Driving Costs, recent editions (new vehicle, first five years) |
| Fuel (gasoline) | price ÷ MPG — about 6¢/mile at 48 MPG and $3.00/gal, up to about 28¢/mile at 16 MPG and $4.50/gal | Arithmetic from the table above |
| Total ownership cost, all categories combined | average of about 82¢ per mile | AAA Your Driving Costs, 2024 edition: average annual cost of about $12,297 for a new vehicle driven 15,000 miles a year |
| Spread by vehicle class | small cars and small hybrids sit well below the average; large SUVs and half-ton pickups sit well above it | AAA Your Driving Costs, class breakdowns |
Two cautions about the ownership figures. They assume a new vehicle in its first five years, so depreciation dominates and the per-mile total is much higher than for a paid-off older car. And they assume 15,000 miles per year — because fixed costs (insurance, registration, depreciation by time) are spread over those miles, driving fewer miles raises the cost per mile and driving more lowers it. Published averages are useful as a sanity check on a budget, not as a figure for your specific vehicle.
Interpreting Your Cost Per Mile
The number this calculator returns is a marginal (variable) trip cost: the money the trip itself consumes, which is fuel plus whatever per-mile wear allowance you chose to add. It answers the question "what does it cost me to drive these extra miles?" — not "what does owning this car cost per mile?"
What the figure excludes
Unless you deliberately build them into the maintenance rate, the result contains no:
- depreciation (usually the single largest ownership cost on a newer vehicle);
- insurance premiums;
- registration, licensing, inspection or road tax;
- financing or lease interest;
- parking, tolls, ferries or congestion charges;
- driver time.
Because of those omissions, this estimate will normally land below full ownership cost per mile and below a composite reimbursement rate such as the US IRS business mileage rate. A 28 MPG sedan at $3.50/gal with a 10¢ wear allowance comes to about 22.5¢ per mile here, against a 2025 IRS business rate of 70¢ per mile — the difference is not an error in either number; the two measure different things.
Reading the fuel/maintenance split
The two terms behave differently, and it is worth looking at which one dominates:
$$\text{Fuel share} = \frac{ {\text{Fuel price} \div \text{MPG}}}{ {\text{Fuel price} \div \text{MPG} + \text{Maint. rate}}}$$
At 16 MPG and $4.50/gal with a 10¢ allowance, fuel is about 74% of the total, so the result is highly sensitive to pump prices and to driving style. At 48 MPG and $3.00/gal, fuel is only about 38% of the total, and the assumed wear rate drives the answer more than the price of fuel does — which also means an uncertain maintenance rate introduces more error in an efficient vehicle than in a thirsty one. If you set the maintenance rate to zero, the output is a pure fuel cost.
Why real-world MPG is lower than the rated figure
Entering a window-sticker or brochure economy number tends to understate cost. Fuel economy falls, sometimes sharply, with:
- City and stop-and-go driving — idling and repeated acceleration consume fuel without covering distance;
- Cold weather and short trips — a cold engine and cabin heating are least efficient in the first several miles, so a series of short winter trips can cost noticeably more per mile than one long trip;
- Sustained high speed — aerodynamic drag rises with the square of speed, and most cars lose efficiency progressively above roughly 50–60 mph (about 80–95 km/h);
- Load, towing and roof boxes — extra mass and frontal area both increase consumption, and towing can cut economy dramatically;
- Terrain, headwinds, underinflated tires and heavy air-conditioning use.
If you have fill-up records, the most accurate input is your own measured MPG (miles driven between fills divided by gallons added) for conditions like the trip you are pricing — not a single lifetime average.
Distance, round trips and detours
The calculator multiplies whatever distance you enter. For a round trip, enter the full there-and-back distance: a 180-mile one-way journey is 360 miles of cost. Add realistic detours, parking searches and wrong turns if the estimate is for a budget rather than a comparison.
Reimbursement and tax deductions
For claiming mileage from an employer or on a tax return, the amount you may claim follows the applicable published rate and the relevant eligibility rules — in the United States, the IRS standard mileage rate and the IRS rules on business, medical, moving and charitable use, including recordkeeping requirements and restrictions on switching between the standard rate and actual-expense methods. Other countries have their own approved rates and conditions. This calculator's output is an estimate of what driving actually costs you; it is not a claimable amount, and a claim is not evidence of your real cost.
This section is general information about how the calculation works and is not financial, tax or legal advice. For a specific reimbursement, deduction or budgeting decision, consult the current official rules for your country or a qualified professional.
Fuel prices this week: United States
Average retail prices of regular gasoline and diesel across the United States, week of 2026-11-09, taxes included, as published by the U.S. Energy Information Administration. Use them as the fuel price in the calculator above.
- Regular gasoline (2026-11-09)
- $3.995/gal +30.7% since 2025-11-10
- Diesel (2026-11-09)
- $6.127/gal +59.7% since 2025-11-10
World crude oil prices, October 2026
World market prices of crude oil in U.S. dollars per barrel, monthly averages from the World Bank. These are commodity prices, not pump prices: the price at the pump also includes refining, distribution and taxes, and it differs from country to country.
- Crude oil, average of Brent, Dubai and WTI (2026-10)
- $108.50/bbl +72.2% since 2025-10
- Brent (2026-10)
- $125.00/bbl +93.2% since 2025-10
- WTI (2026-10)
- $97.70/bbl +62.3% since 2025-10
- Dubai (2026-10)
- $102.70/bbl +59.7% since 2025-10
Pump prices in the EU, week of 2026-11-09
Pump prices of petrol (Euro-super 95) and diesel by EU country, week of 2026-11-09, taxes included. Use them as the fuel price in the calculator above.
- EU average (petrol)
- 1.877 €/L
| Country | Petrol 95 (€/L) | Diesel (€/L) |
|---|---|---|
| Denmark | 2.391 | 2.435 |
| Netherlands | 2.196 | 2.361 |
| Finland | 2.144 | 2.485 |
| France | 2.088 | 2.178 |
| Germany | 2.067 | 2.253 |
| Greece | 2.042 | 2.099 |
| Italy | 1.995 | 2.218 |
| Ireland | 1.958 | 2.119 |
| Portugal | 1.922 | 2.135 |
| Latvia | 1.846 | 2.083 |
| Romania | 1.844 | 2.033 |
| Belgium | 1.844 | 2.357 |
| Lithuania | 1.843 | 2.225 |
| Estonia | 1.805 | 2.084 |
| Croatia | 1.749 | 2.025 |
| Spain | 1.730 | 1.898 |
| Cyprus | 1.699 | 2.000 |
| Slovakia | 1.691 | 1.965 |
| Hungary | 1.673 | 1.985 |
| Austria | 1.670 | 2.087 |
| Czechia | 1.653 | 1.899 |
| Slovenia | 1.634 | 1.950 |
| Luxembourg | 1.627 | 1.987 |
| Bulgaria | 1.582 | 1.896 |
| Sweden | 1.437 | 1.954 |
| Poland | 1.384 | 1.753 |
| Malta | 1.340 | 1.210 |
Latest figure: 2026-11-09 Data last updated 2026-11-11 · current
Source: U.S. Energy Information Administration (EIA), Gasoline and Diesel Fuel Update Public domain (U.S. government work); World Bank, Commodity Markets (Pink Sheet), modified CC BY 4.0; © European Union, Weekly Oil Bulletin (European Commission) CC BY 4.0
Prices per litre are converted by CalculatorLib from the bulletin's prices per 1,000 litres. Changes over one year are computed by CalculatorLib.
Source details and methodology
- U.S. Energy Information Administration (EIA), Gasoline and Diesel Fuel Update — Weekly retail gasoline and diesel prices
- World Bank, Commodity Markets (Pink Sheet), modified — Commodity Markets (Pink Sheet), monthly prices
- © European Union, Weekly Oil Bulletin (European Commission)
FAQ
Should I include maintenance? If you only want pure fuel cost, set the maintenance rate to 0. Including it gives a more realistic total cost of ownership for the trip.
What MPG should I use? Use your real-world average, which is often lower than the EPA sticker, especially in city driving or cold weather.
Does it work for electric vehicles? Not directly — for EVs, replace fuel price with cost per "gallon equivalent" or use a separate cost-per-mile figure based on electricity rates.