

What Is the Annualized Return Calculator?
The annualized return calculator converts the total return you earned over any holding period into an equivalent yearly rate. This lets you fairly compare investments held for different lengths of time — for example, a 10% gain over 6 months versus a 15% gain over 2 years. It is a universal financial math tool and applies to any currency or market.
How to Use It
Enter the beginning value (what you invested), the ending value (what it is worth now), and the number of days you held the investment. The calculator computes your holding period return (HPR) and then annualizes it to show the equivalent compound yearly rate.
The Formula Explained
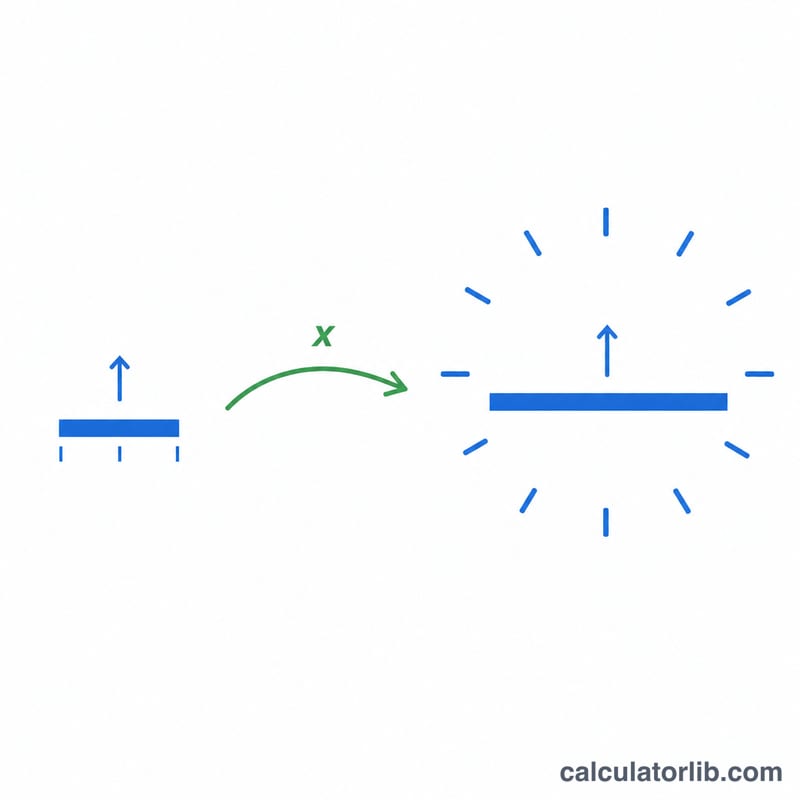
First the holding period return is found: \( \text{HPR} = (\text{Ending} - \text{Beginning}) \div \text{Beginning} \). Then it is annualized using compounding:
$$\text{Annualized} = (1 + \text{HPR})^{\frac{360}{\text{days}}} - 1$$The exponent scales the return to a full year. A 360-day year convention is used here (a common "banker's year" basis); switch the denominator to 365 if you prefer a calendar year.
Worked Example
Suppose you invest 10,000 and it grows to 11,000 over 180 days.
$$\text{HPR} = (11{,}000 - 10{,}000) \div 10{,}000 = 0.10 = 10\%$$$$\text{Annualized} = (1 + 0.10)^{\frac{360}{180}} - 1 = (1.10)^{2} - 1 = 1.21 - 1 = 0.21 = \mathbf{21.07\%}$$Even though you only made 10% in cash, the yearly equivalent rate is about 21% because the gain happened in half a year and compounds.
Key Terms Explained
- Holding Period Return (HPR)
- The total gain or loss on an investment over the entire time it was held, expressed as a fraction of the amount invested. It is calculated as \(\text{HPR} = \frac{\text{Ending Value} - \text{Beginning Value}}{\text{Beginning Value}}\). HPR makes no adjustment for how long the position was held, so a 10% HPR earned over one month and one earned over five years look identical until they are annualized.
- Annualized Return
- The constant yearly compound rate that, if sustained for one full year, would produce the same growth observed over the actual holding period. It standardizes returns of different durations onto a common per-year basis so they can be compared fairly. The calculator computes it as \(\left(\frac{\text{Ending Value}}{\text{Beginning Value}}\right)^{360/\text{Days}} - 1\).
- Holding Period
- The length of time, measured here in days, between the purchase (or starting measurement) and the sale (or ending measurement) of the investment. The number of days is the exponent denominator that scales the return up or down to a yearly figure.
- Beginning Value
- The value of the investment at the start of the holding period — typically the purchase price or the portfolio balance on the start date. It is the denominator of the growth ratio.
- Ending Value
- The value of the investment at the end of the holding period — the sale price or the balance on the end date. It is the numerator of the growth ratio.
- Compounding
- The process by which returns are earned on previously earned returns. Annualized return assumes compounding: the period return is applied repeatedly across the fractional or multiple periods that make up a year, which is why the exponent \(360/\text{Days}\) appears rather than a simple multiplication.
- 360 vs 365 Day-Count Convention
- A day-count convention defines how many days are treated as one full year. The 360-day convention (used by this calculator) is common in money markets and bond pricing for its arithmetic simplicity, while a 365-day (actual/365) convention reflects the true calendar year. The choice slightly changes the result: using 360 produces a marginally different annualized figure than 365 for the same inputs, so always note which convention a quoted rate uses when comparing sources.
Interpreting Your Annualized Return
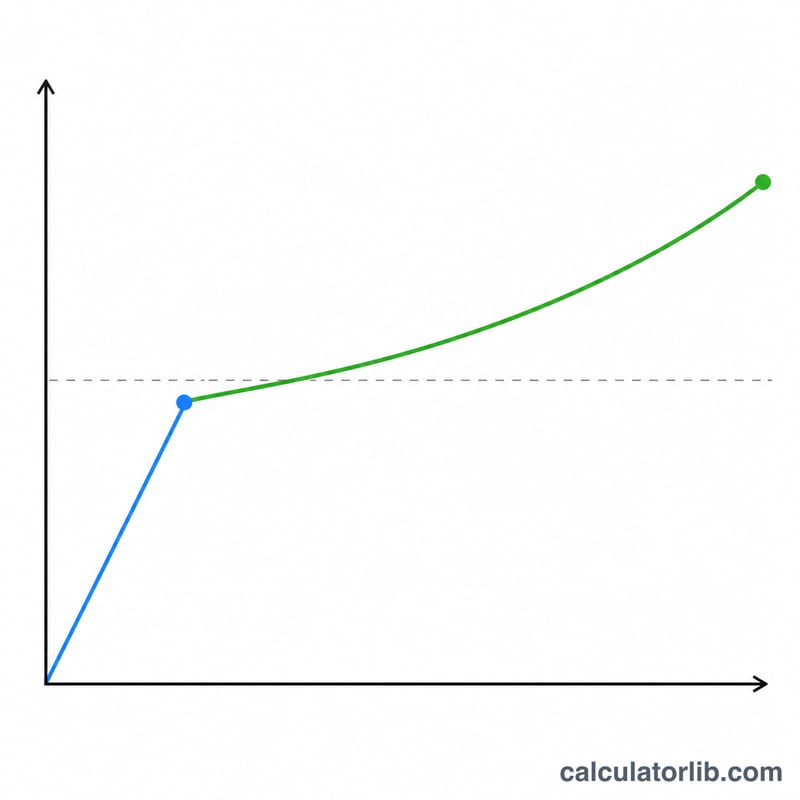
Annualized return answers a single question: if the growth rate observed over your holding period continued steadily for one full year, what yearly rate would that be? It projects the observed performance onto a 12-month horizon so that investments held for different lengths of time can be lined up and compared on equal footing.
Because the calculation raises the period growth ratio to the power \(360/\text{Days}\), short holding periods are scaled up aggressively. A modest gain earned in just a few days implies an enormous exponent and therefore an unrealistically large annualized figure. For example, a 3% gain over 10 days annualizes to roughly 186% — a number no investor should expect to repeat for an entire year. Treat annualized results from very short windows as mathematical extrapolations, not expectations.
The figure also has real limitations. It is a pure price-to-price calculation: it ignores fees, commissions, taxes, and any cash flows such as additional contributions, withdrawals, dividends, or interest received during the period. Those factors can materially change the return you actually keep, so the annualized number is best read as a gross, idealized rate rather than a take-home figure.
Finally, annualized return is a comparison metric, not a forecast. It describes what already happened, restated on a yearly scale; it does not predict future performance, which depends on conditions the formula cannot see. Use it to rank or contrast past results, and pair it with information about risk, costs, and cash flows before drawing conclusions. This is general information, not financial advice.
FAQ
Why is the annualized return higher than my actual gain? Because your holding period was shorter than a year, the calculator projects the same growth rate over a full year, and compounding amplifies it.
Does this work for losses? Yes. If the ending value is lower than the beginning value, HPR is negative and the annualized figure will also be negative.
Should I use 360 or 365 days per year? Both are common. This tool uses 360 (banker's year). The difference is small for most periods and either is acceptable for comparison purposes.