What is the average annual inflation rate?
The average annual inflation rate is the single compound rate that, if applied every year, would carry a starting price level to an ending price level over a given number of years. It is mathematically identical to a Compound Annual Growth Rate (CAGR), applied to prices instead of investments. Because inflation compounds, you cannot simply divide total inflation by the number of years — that would overstate or understate the true yearly pace.
How to use this calculator
Enter the starting price level (for example, a Consumer Price Index value or a basket cost), the ending price level for the same series, and the number of years between the two readings. The calculator returns the average annual inflation rate as a percentage, along with the total cumulative inflation across the whole period.
The formula explained
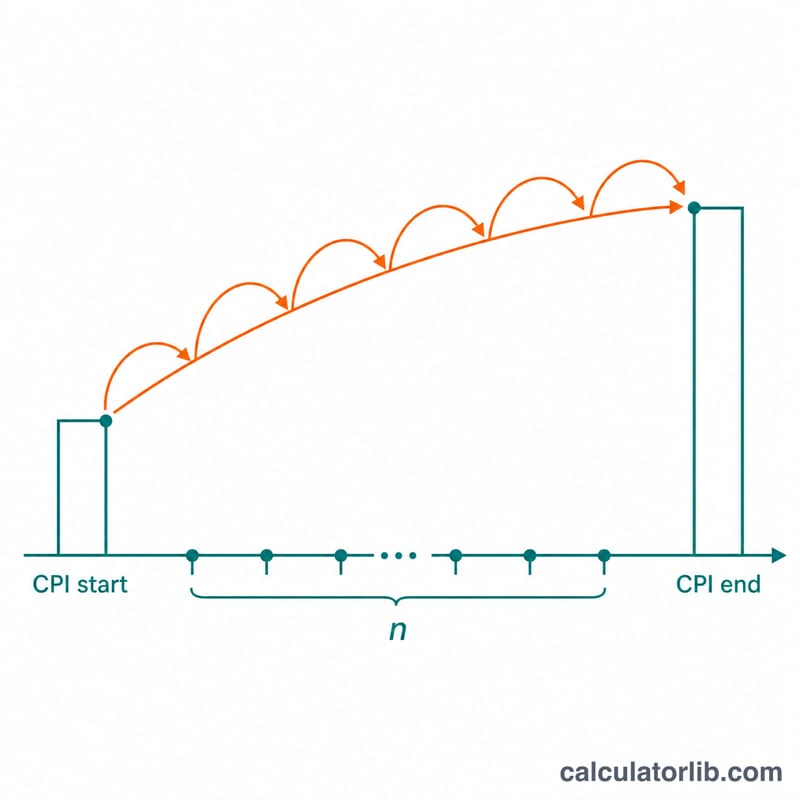
The core equation is $$r = \left(\frac{\text{CPI}_{\text{end}}}{\text{CPI}_{\text{start}}}\right)^{\frac{1}{n}} - 1$$ Dividing the ending value by the starting value gives the total growth factor. Raising it to the power of \(\frac{1}{n}\) "spreads" that growth evenly across each year, and subtracting 1 converts the growth factor into a rate. Multiply by 100 to express it as a percent.
Worked example
Suppose a price index rose from 100 to 150 over 10 years. The growth factor is \(150 / 100 = 1.5\). Raising to the power \(\frac{1}{10}\) gives $$1.5^{0.1} \approx 1.04138$$ so the average annual inflation rate is about 4.14%. The total cumulative inflation over the decade was 50%.
Historical U.S. Inflation Rates by Decade
The table below shows the approximate average annual inflation rate of the U.S. Consumer Price Index (CPI-U) for each decade, derived from published Bureau of Labor Statistics (BLS) CPI data. These figures represent the compound average annual rate (CAGR of the price index) across the decade — the same kind of figure this calculator produces. Values are rounded and intended as general reference points; individual published averages may vary slightly depending on the exact start/end months and CPI series used.
| Decade | Approx. Average Annual CPI Inflation | Character of the period |
|---|---|---|
| 1970s | ~7.1% | High inflation, oil shocks |
| 1980s | ~5.6% | Disinflation after early-1980s peak |
| 1990s | ~3.0% | Moderate, stable prices |
| 2000s | ~2.5% | Low inflation with brief 2008 spike |
| 2010s | ~1.8% | Persistently below the 2% target |
As a worked check using this calculator's formula: a price index rising from \(100\) to roughly \(198\) over \(10\) years implies an average annual rate of \(\left(\left(\tfrac{198}{100}\right)^{1/10}-1\right)\times100\% \approx\) 7.1%, matching the 1970s figure. Always confirm specific published averages against the official BLS CPI series for the exact months you care about.
Interpreting Your Result
This calculator returns two related numbers, and it helps to read them together:
- Average annual rate (CAGR of prices): the single constant yearly rate that, compounded over the chosen number of years, would take the starting price level to the ending price level. It smooths out the ups and downs into one representative figure.
- Total cumulative inflation: the overall percentage change in the price level from start to end, \(\left(\tfrac{\text{Ending}}{\text{Starting}}-1\right)\times100\%\). This is how much prices rose (or fell) in total across the whole period, not per year.
Comparing to central bank targets. Many central banks, including the U.S. Federal Reserve and the European Central Bank, aim for inflation of about 2% per year over the medium term. If your computed average annual rate is well above 2%, prices rose faster than that benchmark over your period; if it is below 2%, they rose more slowly. Because the target is itself an average annual figure, it lines up directly with the rate this calculator produces.
Negative results (deflation). If the ending price level is lower than the starting level, both the average annual rate and the cumulative figure are negative. This indicates deflation — a general fall in the price level over the period. A small negative value spread over many years still reflects a sustained decline, not just a one-time dip.
Average annual vs. year-by-year rates. The average annual rate is a geometric (compound) average, not the simple arithmetic mean of each year's individual inflation rate. Two periods with the same start and end levels produce the same average annual rate even if one had volatile year-to-year swings and the other was steady. To see the actual path — for example a high-inflation year followed by a low one — you need the year-by-year rates, which this tool does not display. The CAGR tells you the net compounded outcome, while year-by-year data tells you how bumpy the road was.
This is general informational content about how price-index figures are calculated and read, not financial advice.
FAQ
Why isn't it just \(50\% \div 10 = 5\%\)? Because inflation compounds. A flat 5% per year would actually produce more than 50% total over a decade, so the true compound rate is slightly lower.
Can I use any price values? Yes — any two comparable figures work: CPI readings, a basket cost, rent, or a single product's price, as long as both are measured the same way.
What if prices fell? If the ending value is below the starting value, the calculator returns a negative rate, indicating average annual deflation.