
What is the Bitcoin ETF Calculator?
A spot Bitcoin ETF lets you gain exposure to Bitcoin through a regular brokerage account without holding the coins yourself. The fund charges an annual expense ratio that quietly reduces your returns. This calculator estimates the net value of your position after one year of fees, along with your gross dollar exposure, the amount of BTC your shares represent, and the yearly fee drag in dollars.
How to use it
Enter the dollar amount you plan to invest, the current Bitcoin price, the amount of BTC each ETF share holds (often a small fraction such as 0.0001), and the fund's annual expense ratio as a percentage. The calculator returns your net value after fees and a breakdown of exposure.
The formula explained
Your gross exposure is simply the dollar amount invested. Each year the fund deducts its expense ratio, so the net value is $$\text{Net Value} = \text{Investment} \times \left(1 - \frac{\text{Expense Ratio (\%)}}{100}\right)$$ To find your BTC exposure, divide the investment by the price per share (\(\text{BTC Price} \times \text{BTC per share}\)) to get the number of shares, then multiply by the BTC each share holds — which simplifies to \(\text{Investment} \div \text{BTC Price}\) coins.
Worked example
Invest $10,000 at a Bitcoin price of $60,000 with a 0.25% expense ratio. Gross exposure is $10,000. Net value: $$\text{Net Value} = 10{,}000 \times (1 - 0.0025) = \mathbf{9{,}975}$$ The annual fee drag is $$\text{Annual Fee} = 10{,}000 \times 0.0025 = \mathbf{25}$$ and your BTC exposure is \(10{,}000 \div 60{,}000 \approx 0.1667\) BTC.
Expense Ratios of Major Spot Bitcoin ETFs
Spot Bitcoin ETFs charge an annual expense ratio (also called the sponsor or management fee) expressed as a percentage of assets. Several issuers launched with temporary fee waivers, so the figures below reflect the standard published sponsor fee. Always confirm the current rate in the fund's prospectus before entering it in the calculator.
| Fund Name | Ticker | Annual Expense Ratio |
|---|---|---|
| iShares Bitcoin Trust | IBIT | 0.25% |
| Fidelity Wise Origin Bitcoin Fund | FBTC | 0.25% |
| Bitwise Bitcoin ETF | BITB | 0.20% |
| ARK 21Shares Bitcoin ETF | ARKB | 0.21% |
| VanEck Bitcoin ETF | HODL | 0.20% |
| Franklin Bitcoin ETF | EZBC | 0.19% |
| Grayscale Bitcoin Trust | GBTC | 1.50% |
| Grayscale Bitcoin Mini Trust | BTC | 0.15% |
Many of the lower-cost funds cluster between 0.15% and 0.25%, while GBTC remains a notable outlier at 1.50%. These are the published sponsor fees; promotional waivers (for example a 0.00% rate for an initial period or up to a certain asset threshold) can temporarily lower the effective cost.
Fee Drag Across Different Expense Ratios
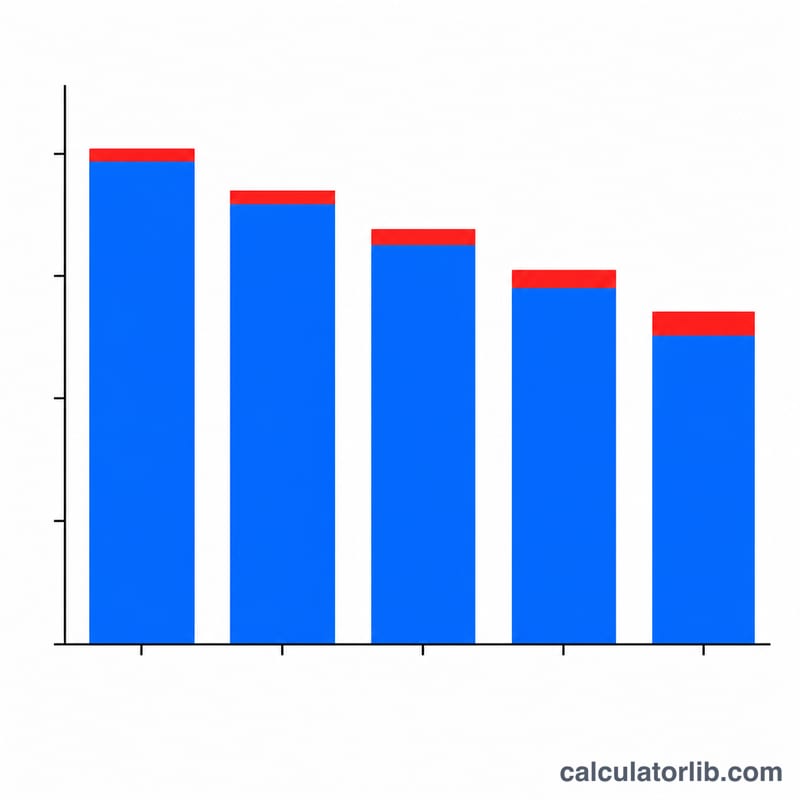
The table below applies a one-year expense ratio to a fixed $10,000 investment to show how much value remains and how many dollars the fee consumes. Net value is computed as \(\text{Investment} \times \left(1 - \frac{\text{Expense Ratio}}{100}\right)\), and the annual fee drag is the difference between the investment and its net value.
| Expense Ratio | Example Fund | Net Value (1 yr) | Annual Fee Drag |
|---|---|---|---|
| 0.12% | Hypothetical low-cost | $9,988.00 | $12.00 |
| 0.20% | BITB / HODL | $9,980.00 | $20.00 |
| 0.25% | IBIT / FBTC | $9,975.00 | $25.00 |
| 0.39% | Mid-cost fund | $9,961.00 | $39.00 |
| 1.50% | GBTC | $9,850.00 | $150.00 |
The gap between a 0.20% fund and GBTC's 1.50% fee is $130 in a single year on $10,000. Because the fee is charged every year on the prevailing balance, that difference compounds and widens substantially over a long holding period.
Understanding Your Net Value and Fee Drag
This calculator separates a few related quantities so you can see what your money actually buys after costs:
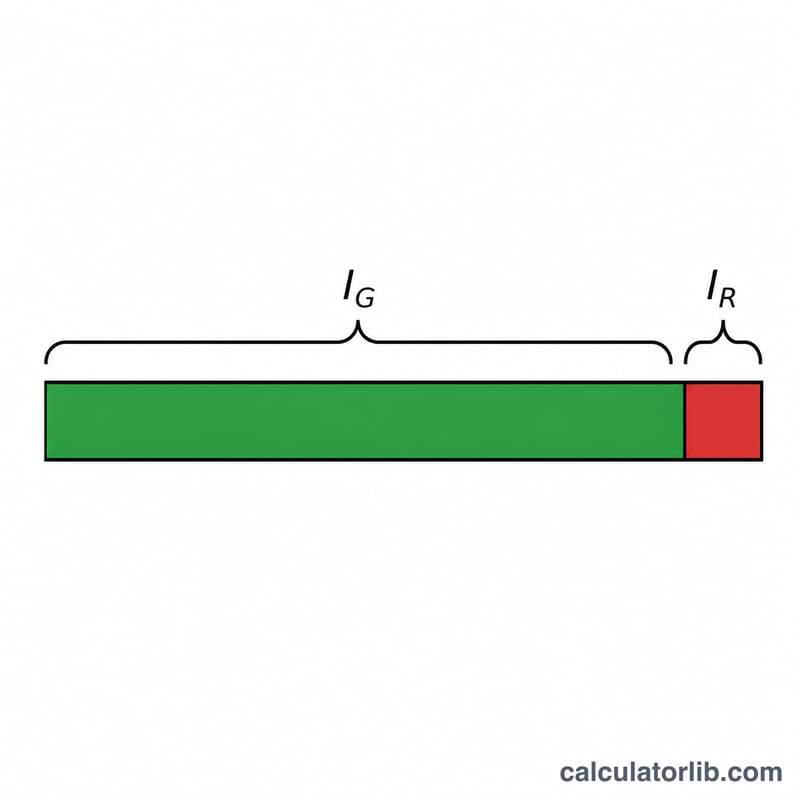
- Gross exposure is the full dollar amount you invest before any fee is removed — the market exposure to Bitcoin you are paying for.
- Net value is the gross investment after subtracting one year of the expense ratio: \(\text{Investment} \times \left(1 - \frac{\text{Expense Ratio}}{100}\right)\). It represents what remains once the fund's stated annual fee is applied.
- BTC exposure is how much Bitcoin your shares represent. With a quoted Bitcoin price and the BTC held per share, your investment can be expressed in fractions of a coin, since each share of a spot ETF is backed by a defined amount of BTC.
- Annual fee drag is the dollar cost of the expense ratio in a year — the difference between your gross investment and its net value. A 0.25% ratio on $10,000 is a $25 yearly drag.
A few important mechanics: the expense ratio is not billed as a separate charge. It accrues daily and is deducted from the fund's net asset value, so it quietly reduces your share price a little each day rather than appearing as a line-item fee. Over multiple years the fee compounds, because each year's percentage is taken on the then-current balance — so the cumulative drag is larger than simply multiplying the one-year fee by the number of years.
The figures here isolate the published expense ratio only. They deliberately exclude Bitcoin's own price movement (which can dwarf the fee in either direction), bid-ask spreads, brokerage commissions, premiums or discounts to NAV, and tracking error — the small gap between the fund's return and the underlying Bitcoin price. Real-world results will differ from this single-fee estimate.
This is general educational information, not investment or financial advice. Verify each fund's current expense ratio and read its prospectus before investing.
FAQ
Does this include trading commissions or spreads? No — it models only the fund's recurring expense ratio. Add brokerage commissions separately.
Is the fee charged all at once? Expense ratios accrue daily but are quoted annually; this tool shows the equivalent one-year cost.
Does it account for Bitcoin price changes? No. It holds the price constant to isolate the impact of fees; actual returns depend on BTC's market movement.