What is body fat mass?
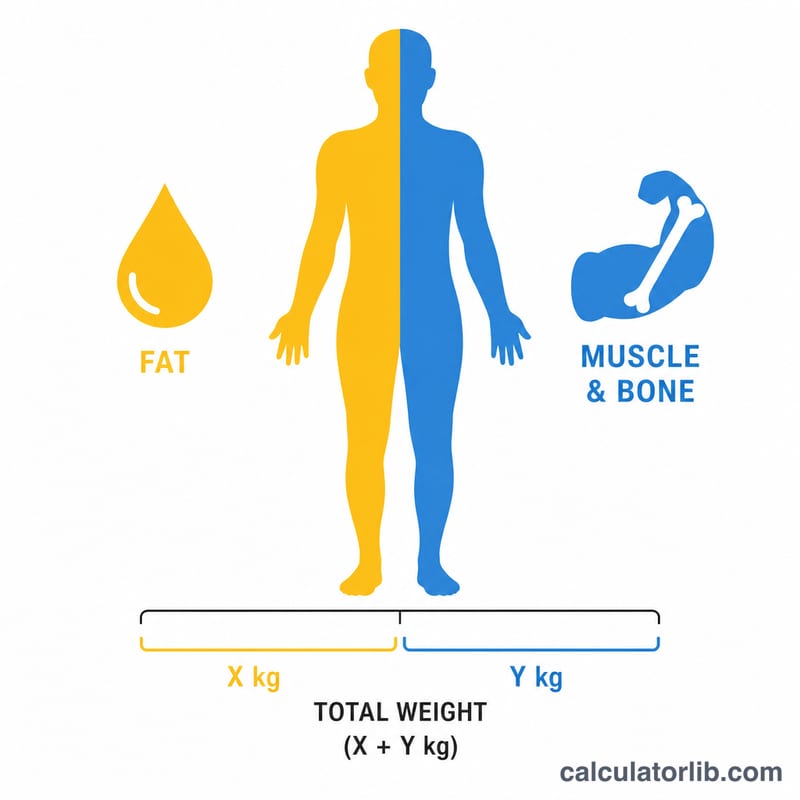
Your total body weight is made up of two parts: fat mass (the weight of stored body fat) and fat-free mass, also called lean mass (muscle, bone, organs, and water). This calculator splits your weight into these two components using your measured body fat percentage. Knowing the actual kilograms of fat — rather than just a percentage — gives a clearer picture of body composition and a more meaningful target to track over time.
How to use the calculator
Enter your body weight in kilograms and your body fat percentage. The body fat percentage can come from a smart scale, calipers, a DEXA scan, or a body-fat estimate calculator. Press calculate to see your fat mass and your fat-free (lean) mass instantly. If you lose weight, comparing fat mass over time tells you whether you're losing fat or losing muscle.
The formula explained
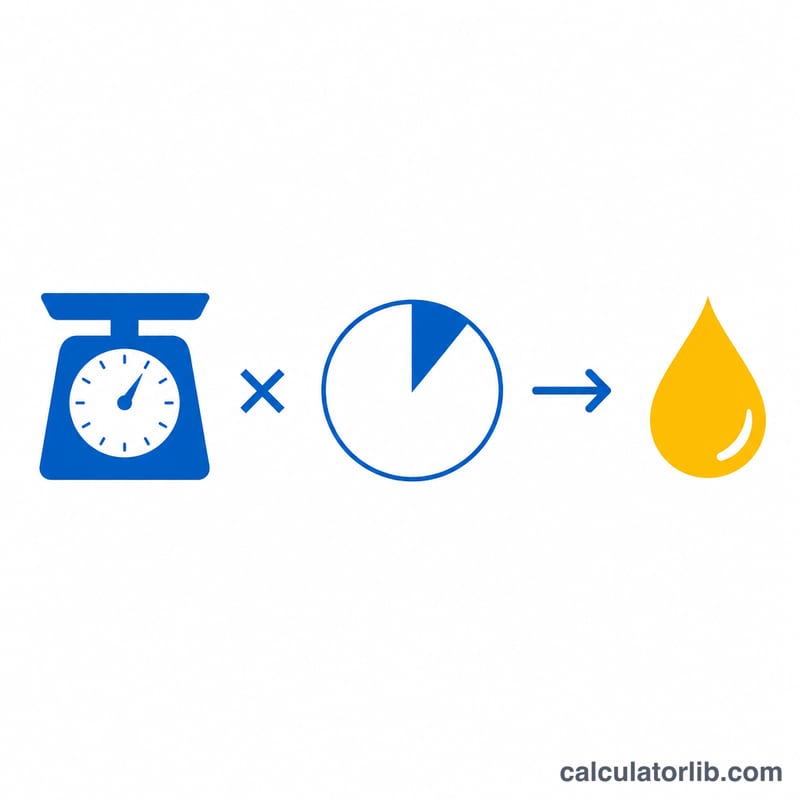
The math is simple. Fat mass equals your weight multiplied by your body fat percentage divided by 100. Fat-free mass is whatever remains:
$$\text{Fat mass} = \text{Weight} \times \frac{\text{Body Fat \%}}{100}$$
$$\text{Fat-free mass} = \text{Weight} - \text{Fat mass}$$
Worked example
Suppose you weigh 80 kg with a body fat percentage of 25%. Fat mass = $$80 \times \left(\frac{25}{100}\right) = 20\ \text{kg}$$ Fat-free mass = $$80 - 20 = 60\ \text{kg}$$ So 20 kg of your body is fat and 60 kg is lean tissue.
Body Fat Percentage Categories
The table below shows the body fat percentage ranges commonly cited by the American Council on Exercise (ACE) and broadly consistent with American College of Sports Medicine (ACSM) descriptive norms. Women carry more essential fat than men, largely due to sex-specific (reproductive and hormonal) fat stores, so the bands differ by sex. Use these ranges to place your own body fat percentage into a recognized category.
| Category | Women (% body fat) | Men (% body fat) |
|---|---|---|
| Essential fat | 10–13% | 2–5% |
| Athletes | 14–20% | 6–13% |
| Fitness | 21–24% | 14–17% |
| Average / Acceptable | 25–31% | 18–24% |
| Obese | 32% and above | 25% and above |
Essential fat is the minimum needed for normal physiological function; sustaining body fat at or below this level can impair health. These are general population reference ranges, not diagnostic thresholds, and individual healthy levels vary with age, genetics and athletic goals.
Interpreting Your Fat Mass and Fat-Free Mass
This calculator splits your total body weight into two components. Fat mass is the absolute weight of all body fat (in kg), while fat-free mass (also called lean mass) is everything else — predominantly skeletal muscle, bone, organs and body water. Together they always add back up to your total weight.
A single snapshot tells you where you currently sit, but the real value comes from tracking the two numbers over time. Body weight alone can be misleading: the scale cannot tell whether a 2 kg drop came from losing fat or losing muscle. By separating fat mass from fat-free mass, you can see which component is actually changing. Falling fat mass with stable or rising fat-free mass usually indicates successful fat loss while preserving muscle — generally the goal of a sound diet and resistance-training program. Falling fat-free mass, by contrast, can signal loss of muscle, which is often undesirable.
Because fat-free mass mostly reflects muscle, bone and water, it tends to be relatively stable day to day; large short-term swings usually reflect changes in hydration rather than true tissue change. For that reason, compare measurements taken under similar conditions (for example, morning, fasted) and look at trends over weeks rather than single readings.
You can compare your computed fat mass to your body fat percentage band in the category table above, which is tied to established ACE/ACSM body-composition norms. This tool reports composition only and does not provide medical advice; for health concerns, consult a qualified professional.
Fat Mass at Different Weights and Body Fat Levels
The examples below apply the formulas \(\text{Fat Mass} = \text{Weight} \times \frac{\text{Body Fat \%}}{100}\) and \(\text{Fat-Free Mass} = \text{Weight} - \text{Fat Mass}\) across a range of weights and body fat percentages. For instance, an 80 kg person at 25% body fat carries \(80 \times \tfrac{25}{100} = \) 20 kg of fat mass and 60 kg of fat-free mass.
| Weight (kg) | Body Fat % | Fat Mass (kg) | Fat-Free Mass (kg) |
|---|---|---|---|
| 60 | 15% | 9.0 | 51.0 |
| 60 | 25% | 15.0 | 45.0 |
| 60 | 35% | 21.0 | 39.0 |
| 80 | 15% | 12.0 | 68.0 |
| 80 | 25% | 20.0 | 60.0 |
| 80 | 35% | 28.0 | 52.0 |
| 100 | 15% | 15.0 | 85.0 |
| 100 | 25% | 25.0 | 75.0 |
| 100 | 35% | 35.0 | 65.0 |
Notice that at the same weight, fat-free mass falls as body fat percentage rises, and at the same body fat percentage, both fat mass and fat-free mass scale up with total weight. To estimate how much fat you would need to lose to reach a target percentage, continue with a goal body fat calculation.
FAQ
What is a healthy body fat percentage? For men, roughly 10–20% is typical and healthy; for women, roughly 18–28%. Athletes are often lower. Ranges vary by age and source.
Does this work in pounds? The result will simply be in whatever unit you enter. If you enter pounds for weight, the fat and lean masses come out in pounds too.
Why track fat mass instead of just percentage? Percentage can stay flat while you change size. Tracking fat mass in kg shows exactly how much fat you've gained or lost.