What is the Dating Theory (Optimal Stopping) Calculator?
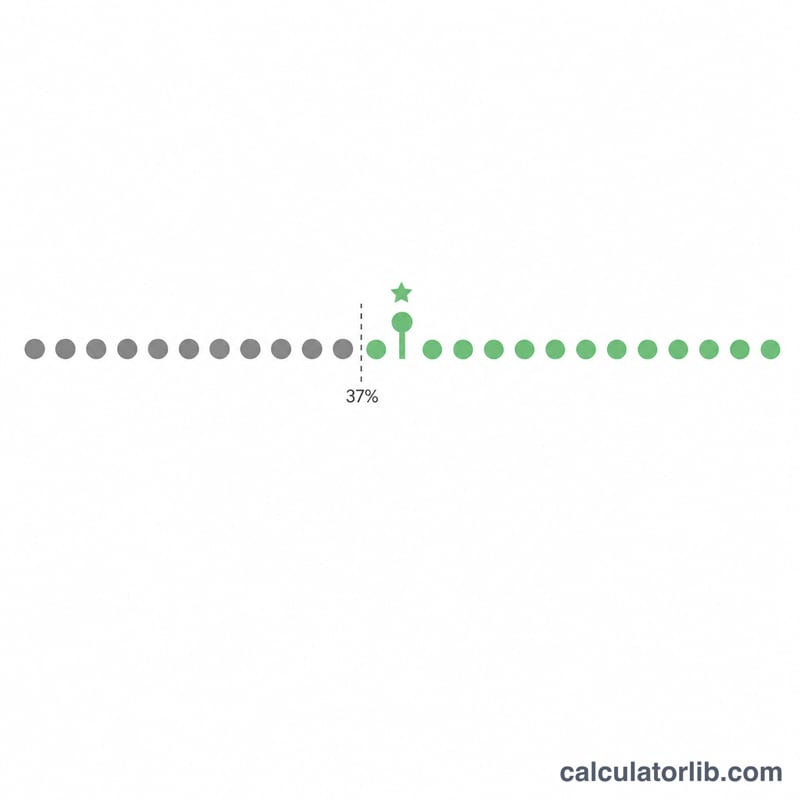
This tool applies the famous "secretary problem" — also called optimal stopping or the 37% rule — to dating. If you expect to meet a fixed number of potential partners and you must decide on each one before moving on, math gives you the strategy that maximizes your chance of choosing the very best person: spend the first portion of the pool just observing, then commit to the first candidate who beats everyone you've seen so far.
How to use it
Enter the number of people you realistically expect to date (your pool size, \(n\)). The calculator returns how many to reject up front. Use that early group purely to calibrate your standards — do not commit to anyone in it, no matter how promising. After the cutoff, say yes to the first person who is better than everyone in your observation phase.
The formula explained
The optimal cutoff is $$\text{Reject Count} = \operatorname{round}\!\left(\frac{\text{Pool Size}}{e}\right)$$ where \(e \approx 2.71828\) is Euler's number. Since \(1/e \approx 0.3679\), you observe about the first 37% of candidates and then start choosing. This rule gives roughly a 37% probability of landing the single best option — far better than random guessing as the pool grows.
Worked example
Suppose you plan to date 10 people. The cutoff is $$\frac{10}{2.71828} \approx 3.68$$ which rounds to 4. So you date and politely pass on the first 4 people, remembering the best of them. From person 5 onward, you commit to the first one who outshines those first 4.
Reject Counts for Different Pool Sizes
The 37% rule says to reject (only observe) roughly \(n/e\) candidates, where \(1/e \approx 0.3679\), and then pick the first later candidate who is better than everyone seen so far. The table rounds \(n/e\) to the nearest whole number.
| Pool size (n) | n / e | Reject count (observe) | Candidates left to choose from | Observation share |
|---|---|---|---|---|
| 5 | 1.84 | 2 | 3 | 40% |
| 10 | 3.68 | 4 | 6 | 40% |
| 20 | 7.36 | 7 | 13 | 35% |
| 30 | 11.04 | 11 | 19 | 36.7% |
| 50 | 18.39 | 18 | 32 | 36% |
| 100 | 36.79 | 37 | 63 | 37% |
Because of rounding, the observation share is not exactly 36.8% for small pools, but it gets closer as the pool grows.
Exact Success Probabilities for Small Pools
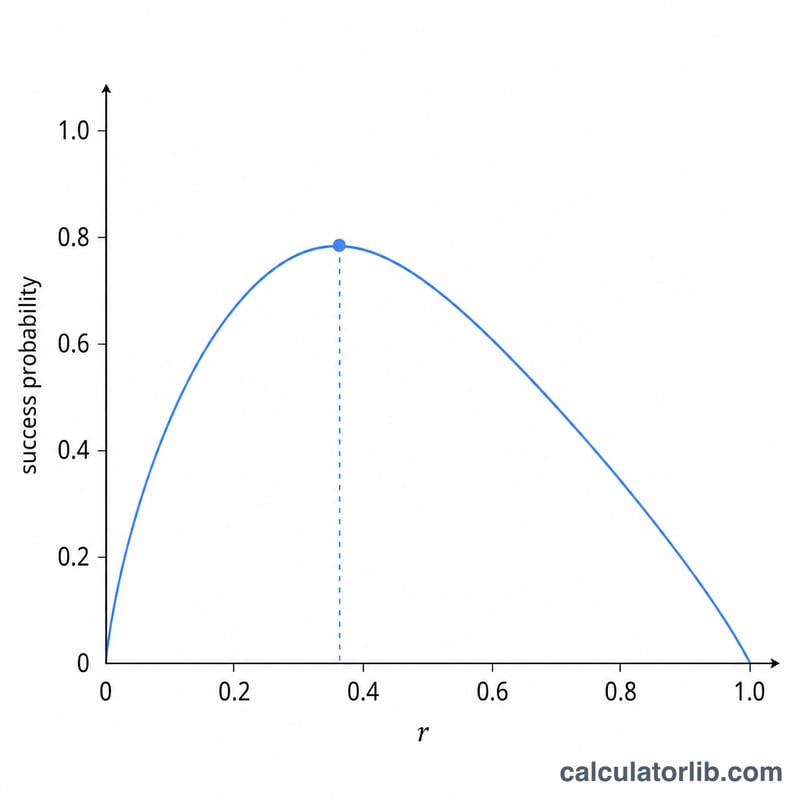
For a pool of \(n\) candidates, if you reject the first \(r\) and then take the first candidate better than all previous ones, the probability of ending up with the single best candidate is
$$P(n,r) = \frac{r}{n}\sum_{k=r+1}^{n}\frac{1}{k-1}$$
The table shows the best \(r\) for each \(n\) and the resulting exact probability (rounded).
| Pool size (n) | Optimal reject count r | Success probability P |
|---|---|---|
| 2 | 1 (0 ties) | 50.0% |
| 3 | 1 | 50.0% |
| 4 | 1 | 45.8% |
| 5 | 2 | 43.3% |
| 10 | 3 | 39.9% |
| 20 | 7 | 38.4% |
| 100 | 37 | 37.1% |
Example for \(n=4,\ r=1\): \(P = \frac{1}{4}\left(1 + \frac{1}{2} + \frac{1}{3}\right) = \frac{1}{4}\cdot 1.8333 \approx 0.458\).
As \(n\) grows, the optimal \(r/n\) approaches \(1/e \approx 0.368\) and the best achievable success probability also converges to \(1/e \approx 36.8\%\) from above.
Interpreting Your Result
The reject count is the length of the observation phase. During it you look at candidates only to calibrate what a strong option looks like, and you commit to none of them. After it ends, you take the first candidate who beats the best of everyone you observed.
Best pick versus good-enough pick. The 37% rule maximizes the chance of selecting the single best candidate in the pool. That chance tops out at about 37%, so the strategy fails to pick the best about 63% of the time. Sometimes you end up with no one at all, if the best candidate appeared during the observation phase. If your goal is a good-enough choice, such as someone in the top few, other stopping rules or thresholds are used, and they typically give a much higher chance of an acceptable result.
Assumptions of the classic model:
- The total pool size \(n\) is fixed and known in advance.
- Candidates are seen one at a time, in random order.
- You can rank each candidate against those already seen, with no ties.
- Each decision is final: you cannot go back to a rejected candidate, and an accepted one ends the search.
- Only getting the very best counts as success.
Real situations rarely satisfy all of these, so treat the result as an illustration of a mathematical model (the secretary problem), not as relationship advice.
FAQ
Does this guarantee I find "the one"? No. It maximizes the probability of picking the best available candidate, but that probability is about 37% — it's a strategy, not a certainty.
What if a great person appears during the observation phase? The strict model says reject them; they only serve to set your benchmark. In real life, treat the rule as guidance rather than a hard law.
Is 37% always the answer? The sampling fraction (\(1/e \approx 37\%\)) is constant, but the actual reject count depends on your pool size \(n\).