What This Calculator Does
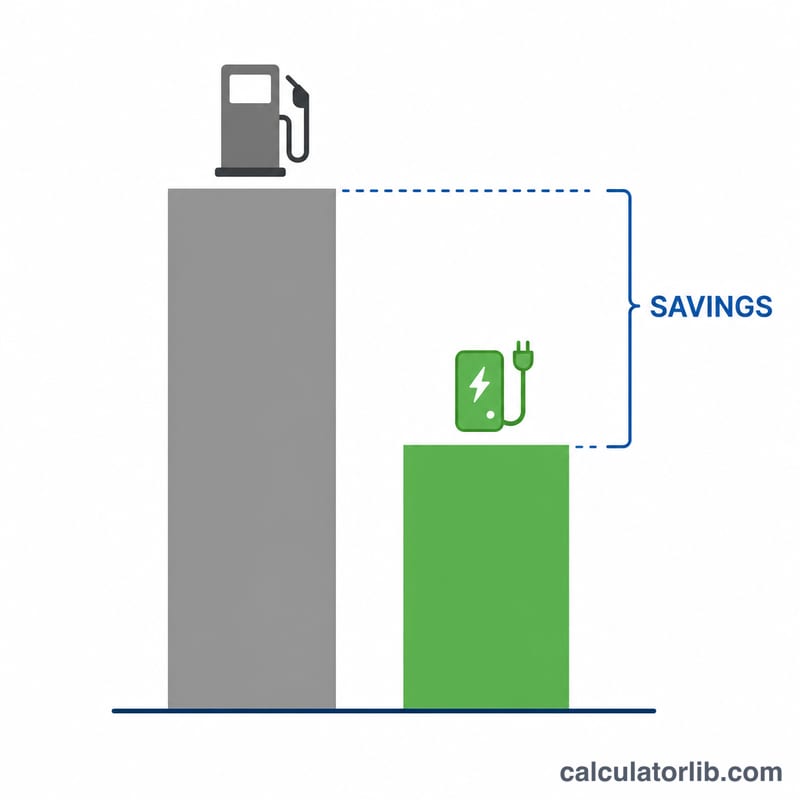
The EV vs Gas Cost Comparison Calculator shows how much money you can save by driving an electric vehicle instead of a gasoline car over a given distance. It converts your mileage into both gallons of gas and kilowatt-hours of electricity, multiplies each by its price, and reports the difference as your savings.
How to Use It
Enter the miles you drive (per trip, month, or year), the gas car's fuel economy in miles per gallon (MPG), and the local gas price per gallon. Then enter your EV's efficiency in miles per kilowatt-hour (mi/kWh) and your electricity price per kWh. The calculator returns your gas cost, EV charging cost, and net savings.
The Formula Explained
Gas cost equals miles divided by MPG, multiplied by the price per gallon. EV cost equals miles divided by efficiency (mi/kWh), multiplied by the price per kWh. Savings is simply gas cost minus EV cost. A positive number means electric is cheaper; a negative number means gas is cheaper for your inputs.
$$\text{Savings} = \left(\frac{\text{Miles}}{\text{MPG}} \times \text{Gas Price}\right) - \left(\frac{\text{Miles}}{\text{mi/kWh}} \times \text{Elec Price}\right)$$
Worked Example
Drive 1,000 miles. A gas car at 25 MPG uses 40 gallons; at $3.50/gallon that's $140. An EV at 3.5 mi/kWh uses about 285.7 kWh; at $0.15/kWh that's about $42.86. Savings = \(\$140 - \$42.86 = \) about $97.14 over those 1,000 miles.
$$\text{Savings} = \$140 - \$42.86 \approx \$97.14$$
Fuel prices this week: United States
Average retail prices of regular gasoline and diesel across the United States, week of 2026-11-09, taxes included, as published by the U.S. Energy Information Administration. Use them as the fuel price in the calculator above.
- Regular gasoline (2026-11-09)
- $3.995/gal +30.7% since 2025-11-10
- Diesel (2026-11-09)
- $6.127/gal +59.7% since 2025-11-10
World crude oil prices, October 2026
World market prices of crude oil in U.S. dollars per barrel, monthly averages from the World Bank. These are commodity prices, not pump prices: the price at the pump also includes refining, distribution and taxes, and it differs from country to country.
- Crude oil, average of Brent, Dubai and WTI (2026-10)
- $108.50/bbl +72.2% since 2025-10
- Brent (2026-10)
- $125.00/bbl +93.2% since 2025-10
- WTI (2026-10)
- $97.70/bbl +62.3% since 2025-10
- Dubai (2026-10)
- $102.70/bbl +59.7% since 2025-10
Pump prices in the EU, week of 2026-11-09
Pump prices of petrol (Euro-super 95) and diesel by EU country, week of 2026-11-09, taxes included. Use them as the fuel price in the calculator above.
- EU average (petrol)
- 1.877 €/L
| Country | Petrol 95 (€/L) | Diesel (€/L) |
|---|---|---|
| Denmark | 2.391 | 2.435 |
| Netherlands | 2.196 | 2.361 |
| Finland | 2.144 | 2.485 |
| France | 2.088 | 2.178 |
| Germany | 2.067 | 2.253 |
| Greece | 2.042 | 2.099 |
| Italy | 1.995 | 2.218 |
| Ireland | 1.958 | 2.119 |
| Portugal | 1.922 | 2.135 |
| Latvia | 1.846 | 2.083 |
| Romania | 1.844 | 2.033 |
| Belgium | 1.844 | 2.357 |
| Lithuania | 1.843 | 2.225 |
| Estonia | 1.805 | 2.084 |
| Croatia | 1.749 | 2.025 |
| Spain | 1.730 | 1.898 |
| Cyprus | 1.699 | 2.000 |
| Slovakia | 1.691 | 1.965 |
| Hungary | 1.673 | 1.985 |
| Austria | 1.670 | 2.087 |
| Czechia | 1.653 | 1.899 |
| Slovenia | 1.634 | 1.950 |
| Luxembourg | 1.627 | 1.987 |
| Bulgaria | 1.582 | 1.896 |
| Sweden | 1.437 | 1.954 |
| Poland | 1.384 | 1.753 |
| Malta | 1.340 | 1.210 |
Latest figure: 2026-11-09 Data last updated 2026-11-11 · current
Source: U.S. Energy Information Administration (EIA), Gasoline and Diesel Fuel Update Public domain (U.S. government work); World Bank, Commodity Markets (Pink Sheet), modified CC BY 4.0; © European Union, Weekly Oil Bulletin (European Commission) CC BY 4.0
Prices per litre are converted by CalculatorLib from the bulletin's prices per 1,000 litres. Changes over one year are computed by CalculatorLib.
Source details and methodology
- U.S. Energy Information Administration (EIA), Gasoline and Diesel Fuel Update — Weekly retail gasoline and diesel prices
- World Bank, Commodity Markets (Pink Sheet), modified — Commodity Markets (Pink Sheet), monthly prices
- © European Union, Weekly Oil Bulletin (European Commission)
FAQ
What is a typical EV efficiency? Most EVs achieve 3 to 4 mi/kWh; larger trucks and SUVs may be 2 to 2.5 mi/kWh.
Does this include charging losses? No. To account for charger inefficiency, lower your mi/kWh figure by roughly 10–15%.
Can I use it for yearly savings? Yes—just enter your annual miles to see annual savings.