What This Calculator Does
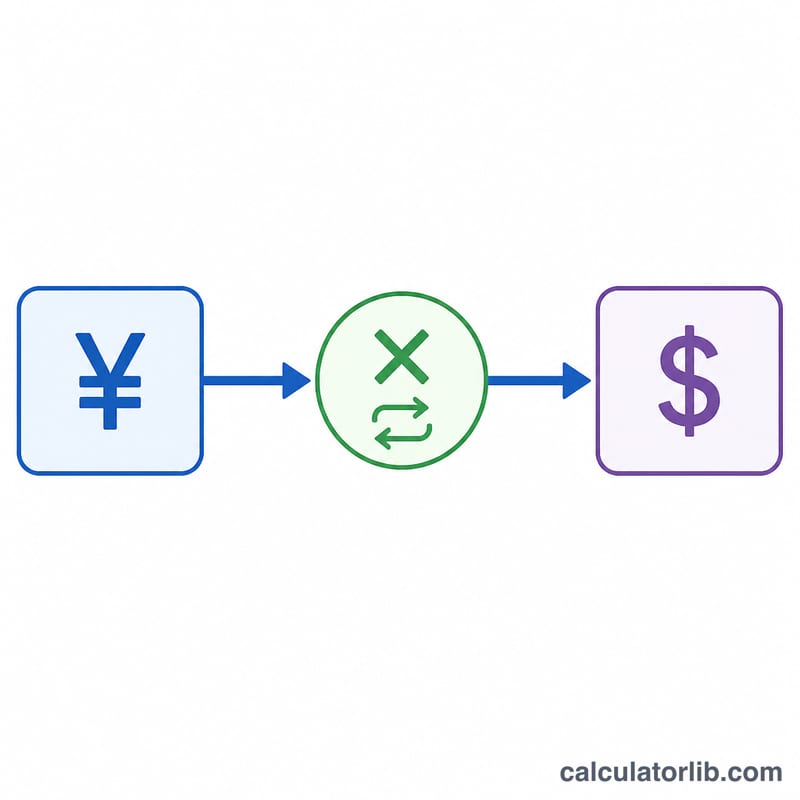
The Foreign Currency Price Comparison Calculator converts a price shown in a foreign currency into the equivalent amount in your home currency. Whether you are shopping abroad, browsing an international website, or reviewing a hotel bill, it instantly tells you what a sticker price really costs in money you understand.
How to Use It
Enter the price as it appears in the foreign currency, then enter the exchange rate expressed as the number of home-currency units you get for one unit of the foreign currency. For example, if 1 EUR = 1.08 USD, enter 1.08. The calculator multiplies the two values to give your home-currency price.
The Formula Explained
The math is a simple multiplication:
$$\text{Home Price} = \text{Foreign Price} \times \text{Exchange Rate}$$
The exchange rate acts as a conversion factor. If the rate is greater than 1, the home currency is "weaker" and prices look larger; if it is less than 1, your home currency buys more.
Worked Example
Suppose a jacket is listed at €100 and the EUR→USD rate is 1.08. The home price is $$100 \times 1.08 = \$108.00$$ So the jacket costs you about 108 US dollars before any card fees.
Exchange rate and purchasing power: United States
Market exchange rate: USD per EUR
Daily euro reference rates published by the European Central Bank: the latest rate, its change over one year and the main currencies against the US Dollar.
- Market rate on 2026-11-16
- 1 EUR = 1.1014 USD
- Change since 2025-11-14
- −5.4%
From 2025-11-14 to 2026-11-16, one EUR went from 1.1648 to 1.1014 USD: the US Dollar strengthened against the Euro.
| Currency | USD per unit | Change in 1 year |
|---|---|---|
| EUR Euro | 1.1014 | −5.4% |
| JPY Japanese Yen | 0.006266 | −3.6% |
| GBP British Pound | 1.3198 | +0.2% |
| CNY Chinese Yuan | 0.15 | +6.4% |
| CHF Swiss Franc | 1.1915 | −6.0% |
| CAD Canadian Dollar | 0.7 | −1.9% |
| AUD Australian Dollar | 0.6757 | +3.5% |
| KRW South Korean Won | 0.0007491 | +8.7% |
| INR Indian Rupee | 0.01065 | −5.6% |
Reference rates are for information: banks, card networks and exchange offices apply their own rates and fees. Rates the source does not quote directly are cross rates calculated through the Euro.
Price levels around the world (United States = 100%)
| Country | Price level (US = 100%) | Year |
|---|---|---|
| United States | 100% | |
| United Kingdom | 92% | 2025 |
| France | 83% | 2025 |
| Germany | 81% | 2025 |
| Japan | 69% | 2025 |
| South Korea | 62% | 2025 |
| Mexico | 59% | 2025 |
| Saudi Arabia | 50% | 2025 |
| China | 48% | 2025 |
| Brazil | 46% | 2025 |
| Türkiye | 45% | 2025 |
| Russia | 37% | 2025 |
| Thailand | 32% | 2025 |
| Indonesia | 31% | 2025 |
| Vietnam | 30% | 2024 |
| India | 23% | 2025 |
Below 100%: the same basket of goods and services costs less than in the United States at market exchange rates.
Latest figure: 2026-11-16 Data last updated 2026-11-16 · current
Source: European Central Bank, euro foreign exchange reference rates ECB reuse policy; The World Bank Group CC BY 4.0
Price levels (PPP rate divided by the official rate) and dollar equivalents are computed by CalculatorLib from these data. Inverse rates, cross rates and 1-year changes are computed by CalculatorLib from these data.
Source details and methodology
- European Central Bank, euro foreign exchange reference rates
- The World Bank Group — World Development Indicators (PA.NUS.FCRF, PA.NUS.PRVT.PP)
FAQ
Where do I find the exchange rate? Use a live source such as your bank, a currency app, or a search engine. Note that banks and cards often add a 1–3% markup.
Which direction should the rate go? Always enter how much of your home currency equals one unit of the foreign currency.
Does this include card or ATM fees? No. This shows the pure converted price; add your card's foreign-transaction fee separately for the true cost.