
What Is Fielding Percentage?
Fielding percentage (FPCT) is a baseball and softball statistic that measures how reliably a defensive player handles the chances hit or thrown their way. It is the share of total defensive chances a fielder converts into outs without committing an error. A value of 1.000 means the player has never made an error on any chance; the closer to 1.000, the more dependable the glove.
How to Use This Calculator
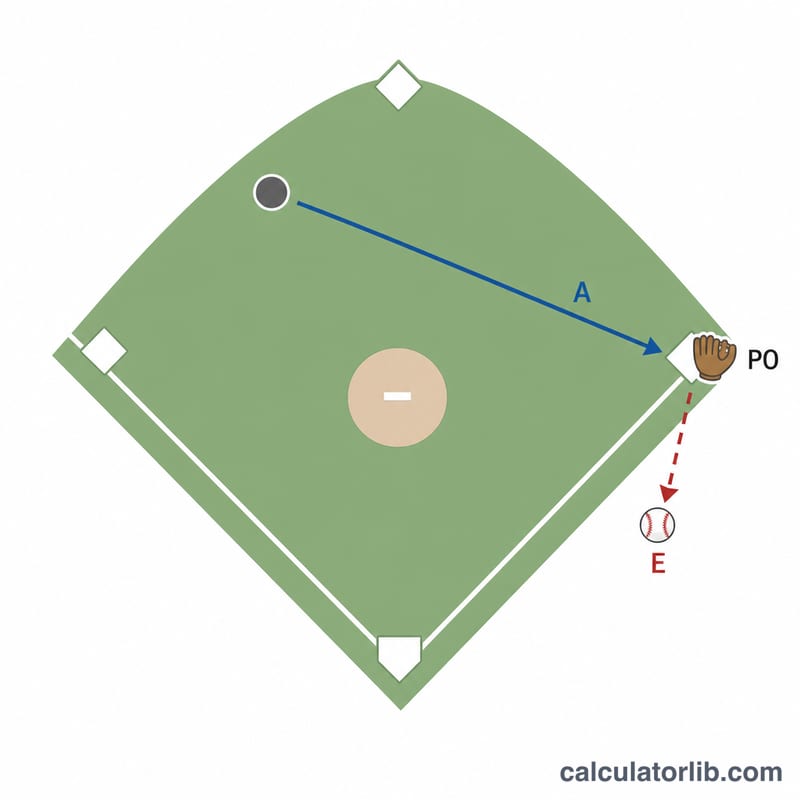
Enter three numbers from a box score or season stat line: Putouts (PO) — outs the player recorded directly (catching a fly ball, tagging a runner, stepping on a base); Assists (A) — throws or deflections that led to an out by a teammate; and Errors (E) — misplays that should have resulted in an out. The calculator returns the fielding percentage along with total chances and successful plays.
The Formula Explained
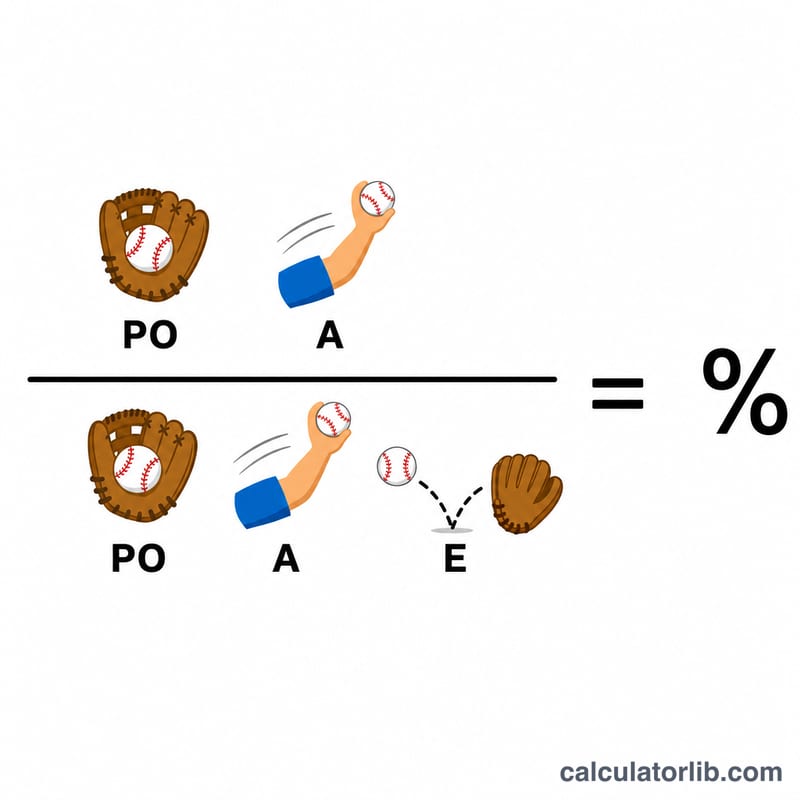
The equation is $$\text{FPCT} = \frac{\text{PO} + \text{A}}{\text{PO} + \text{A} + \text{E}}$$ The numerator counts every successful defensive play, while the denominator counts every chance, including the ones botched. Total chances (TC) is simply \(\text{PO} + \text{A} + \text{E}\). Fielding percentage is conventionally reported to three decimal places, like .987.
Worked Example
Suppose a shortstop has 200 putouts, 50 assists, and 5 errors. Total chances = \(200 + 50 + 5 = 255\). Successful plays = \(200 + 50 = 250\). $$\text{FPCT} = \frac{250}{255} = 0.980$$ (reported as .980). That is a solid fielding percentage for an infielder.
FAQ
What is a good fielding percentage? League-average fielders hover around .960–.990 depending on position; first basemen and outfielders tend to post higher numbers than shortstops and third basemen.
Does fielding percentage measure range? No. It only reflects plays a fielder actually attempts. A player with limited range may have a high FPCT simply because they reach fewer difficult balls.
What if a player has zero chances? Fielding percentage is undefined with no chances; this calculator returns 0 to avoid dividing by zero.