
What This Tool Does
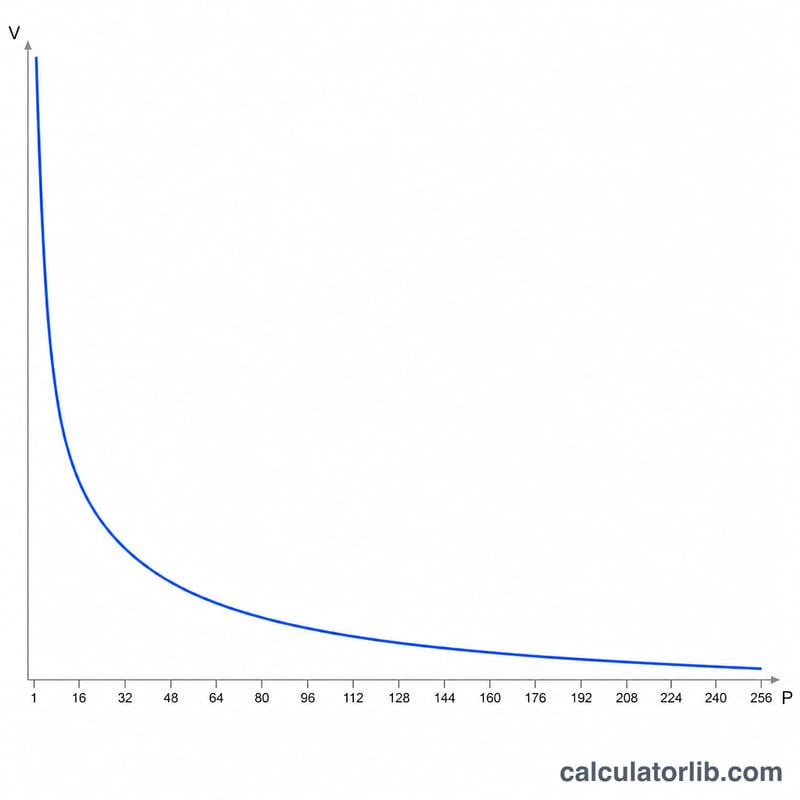
Applies to: United States — American football (NFL). This calculator evaluates an NFL draft-pick trade using the long-standing "Jimmy Johnson" Draft Pick Value Chart. The chart assigns a fixed point value to each overall draft selection, from pick 1 (3,000 points) down through the late seventh round (under 2 points). Front offices have used it for decades as a quick way to balance trades. Note for non-US readers: this is an industry convention and negotiating heuristic, not an official league rule or a precise measure of a player's worth.
How To Use It
Enter the overall pick numbers each side is sending in the trade. "Overall pick" means the selection number in the draft order — pick 1 is the first overall selection, pick 33 is the first pick of round two, and so on. Trader A and Trader B each support up to five picks; the first box on each side is required, and the rest are optional. The calculator looks up every pick's chart value, sums each side, and reports the total value, the point difference, which side comes out ahead, and the percentage edge.
The Formula
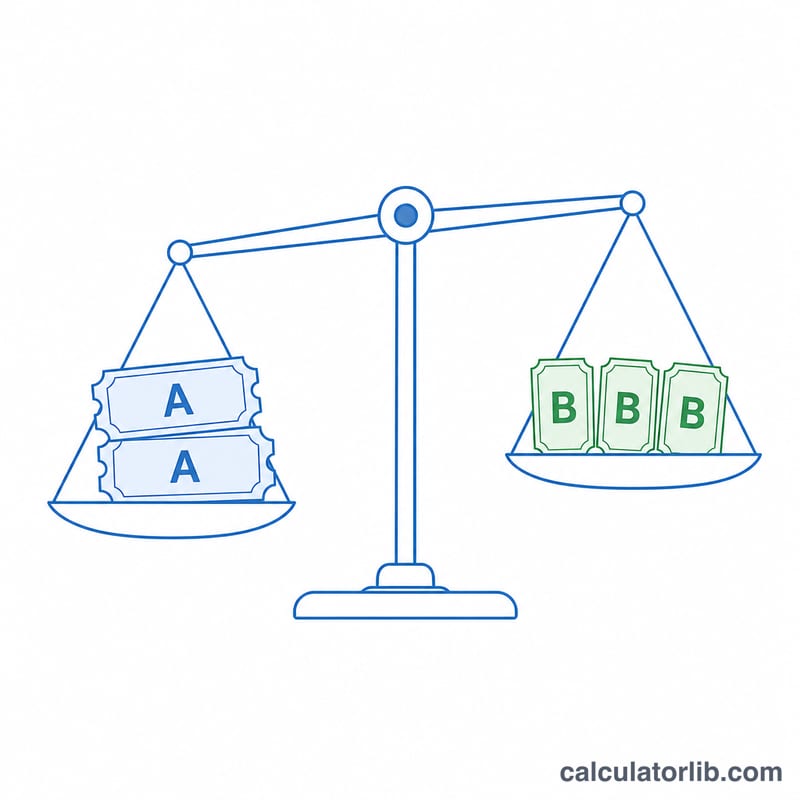
For each side, the total value is the sum of the chart value \(V(n)\) of every pick number \(n\) entered. The point difference is the absolute gap between the two totals. The gain/loss percent expresses that gap relative to the smaller total: $$\text{Gain\%} = \frac{|A - B|}{\min(A, B)} \times 100$$ The "winner" is simply the side with the larger total, or "Even" if they match.
Worked Example
Trader A sends pick 1 (3,000 points). Trader B sends pick 4 (1,800) and pick 6 (1,600), totaling 3,400. The difference is 400 points, so Trader B is the better side of the trade. The gain percent is $$400 / 3{,}000 \times 100 = 13.33\%$$ A perfectly balanced example: pick 5 (1,700) plus pick 50 (400) equals 2,100, which exactly matches pick 10 (1,300) plus pick 40 (500) plus pick 60 (300) — an even trade.
FAQ
Is the chart official? No. It is a widely used convention popularized in the 1990s; teams adjust it with their own models, but it remains a useful baseline.
What about picks late in round seven? The published chart runs to about pick 224. Picks beyond that are worth roughly zero points and are treated as 0 here.
Can totals be tied? Yes — when both sides sum to the same value the result is "Even" with a 0% gain.