
What Is the Absorption Rate?
The absorption rate measures how quickly homes are selling in a given market. It is calculated by dividing the number of homes sold during a period by the number of active listings, giving the percentage of inventory absorbed per month. The closely related "months of inventory" figure tells you how long it would take to sell every current listing if no new homes came on the market.
How to Use This Calculator
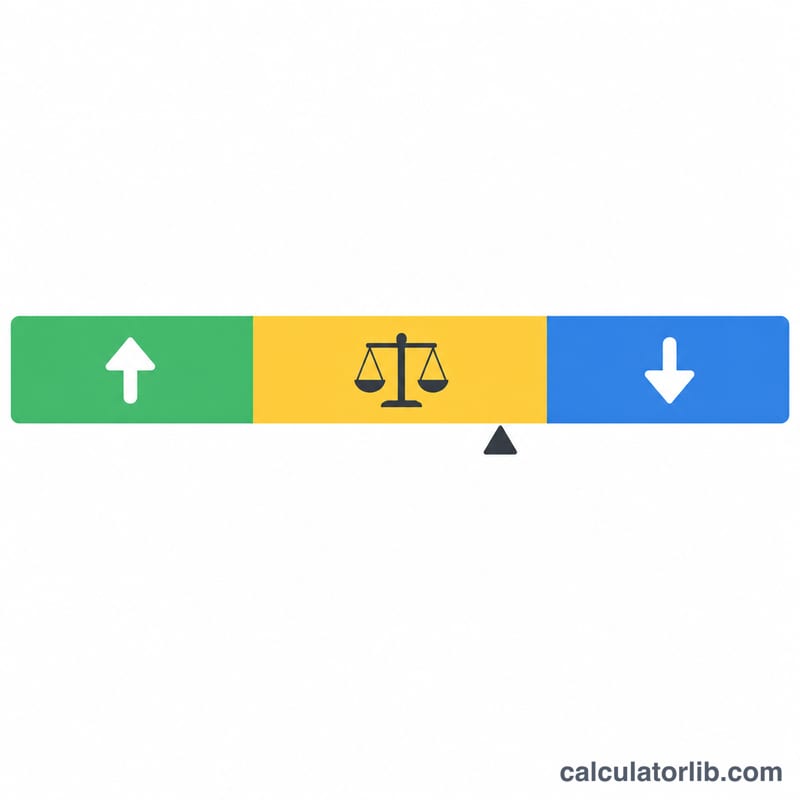
Enter the number of active listings (current inventory), the number of homes sold, and the length of the sales period in months. The calculator converts sales into a monthly pace, then computes the absorption rate and months of inventory. As a rule of thumb, fewer than about 5–6 months of inventory signals a seller's market, while more than 6–7 months points to a buyer's market.
The Formula Explained
First we find homes sold per month: \(\text{Homes Sold} \div \text{Period}\). Months of Inventory is then \(\text{Active Listings} \div \text{Homes Sold per Month}\). The absorption rate as a percentage is \((\text{Homes Sold per Month} \div \text{Active Listings}) \times 100\). The two metrics are reciprocals scaled to different units.
$$\text{Months of Inventory} = \dfrac{\text{Active Listings}}{\text{Homes Sold per Month}}$$ $$\text{Absorption Rate} = \dfrac{\text{Homes Sold per Month}}{\text{Active Listings}} \times 100\%$$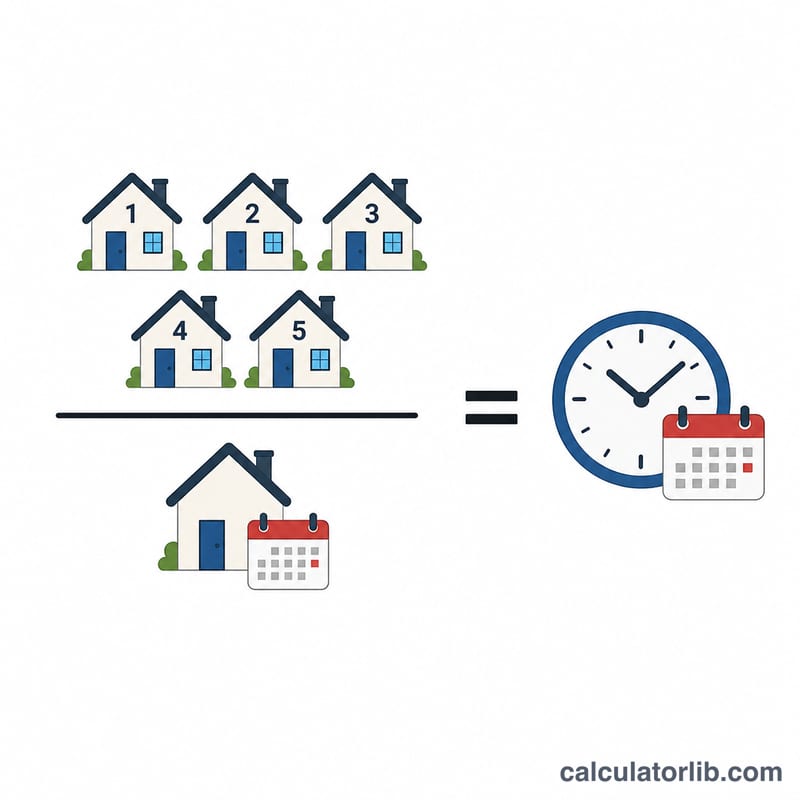
Worked Example
Suppose a market has 200 active listings and 60 homes sold over 3 months. Homes sold per month = \(60 \div 3 = 20\). Months of inventory = \(200 \div 20 = 10\) months. Absorption rate = \((20 \div 200) \times 100 = 10\%\) per month. Ten months of inventory indicates a buyer's market with relatively slow sales.
$$\text{Months of Inventory} = \dfrac{200}{20} = 10 \text{ months}$$Months of Inventory Market Thresholds
The absorption rate measures how quickly homes sell in a given market. Months of inventory (MOI) is its inverse — the number of months it would take to sell all current active listings at the current pace of sales. The two are directly related:
$$\text{Months of Inventory} = \frac{\text{Active Listings}}{\text{Homes Sold per Month}} = \frac{100}{\text{Monthly Absorption Rate (\%)}}$$
The widely used real-estate rule of thumb interprets these figures as follows. A high absorption rate (low inventory) favors sellers, while a low absorption rate (high inventory) favors buyers.
| Months of Inventory | Monthly Absorption Rate | Market Type | Implication |
|---|---|---|---|
| < 4 months | > 25% | Strong seller's market | Low supply, fast sales, rising prices, bidding wars likely |
| 4 – 6 months | 16.7% – 25% | Seller's market | Demand outpaces supply; favorable conditions for sellers |
| 6 – 7 months | 14.3% – 16.7% | Balanced market | Supply and demand roughly even; prices stable |
| > 7 months | < 14.3% | Buyer's market | Excess supply, slower sales, downward price pressure |
As a worked check, a market with 120 active listings and 30 homes sold over a 2-month period sells 15 homes per month, giving a monthly absorption rate of 12.5% — corresponding to 8 months of inventory, which falls in the buyer's-market range.
FAQ
What is a good absorption rate? A higher absorption rate (above roughly 15–20% per month) favors sellers; a lower rate favors buyers.
How does it relate to months of inventory? Months of inventory is the inverse of the monthly absorption rate. A 10% monthly rate equals 10 months of inventory.
What period should I use? Many agents use the trailing 3, 6, or 12 months of sales to smooth out seasonal swings.