
What is the Average Percentage Calculator?
This tool finds the average of two or more percentages. It can return a simple mean (just add the percentages and divide by how many there are) or, more accurately, a weighted average that accounts for the size of each group behind each percentage. Averaging percentages naively can be misleading when the groups differ in size — this calculator solves that.
How to use it
Enter your percentages as a comma-separated list, for example 80, 90, 75. If each percentage came from a different sample size, also enter the totals/weights in the same order, for example 50, 30, 20. Leave the totals box blank to get a plain simple mean. The result shows the average percentage, the number of values, and which method was applied.
The formula explained
The simple mean is $$\overline{P} = \frac{\sum \text{Percentages}}{n}$$ The weighted average is $$\overline{P} = \frac{\sum\left(\frac{p_i}{100}\cdot w_i\right)}{\sum w_i} \times 100$$ — internally each percent is converted to a fraction, multiplied by its total to recover the actual count, summed, and divided by the combined total. This gives the true overall percentage rather than the average of percentages.
Worked example
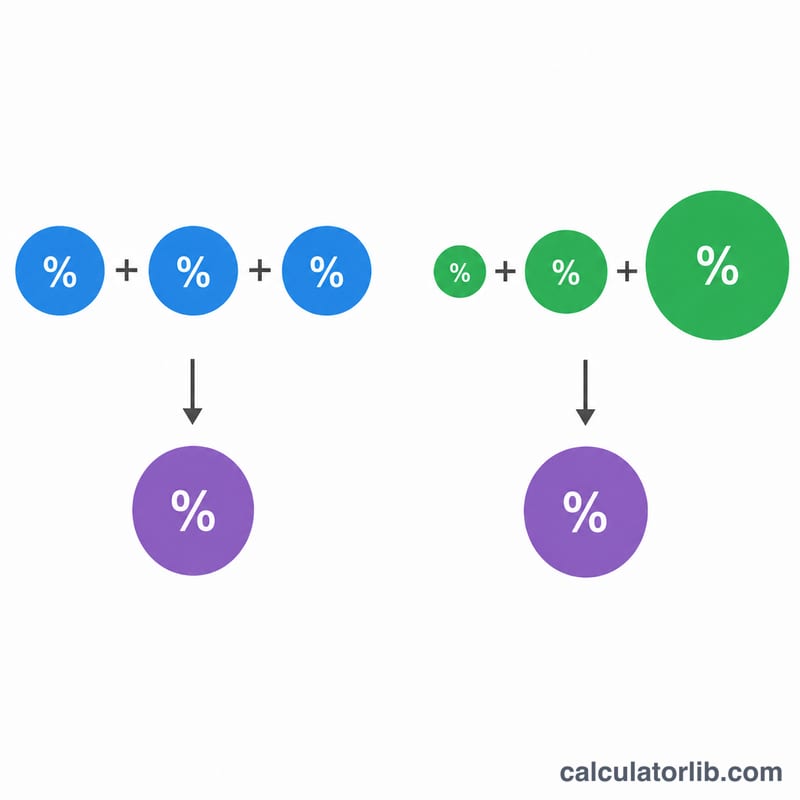
Suppose Test A scored 80% on 50 questions, Test B scored 90% on 30 questions, and Test C scored 75% on 20 questions. The simple mean would be $$\frac{80 + 90 + 75}{3} = 81.67\%$$ But weighting by question count gives $$\frac{0.80 \times 50 + 0.90 \times 30 + 0.75 \times 20}{100} = \frac{40 + 27 + 15}{100} = 82\%$$ The weighted figure is the correct overall score.
Simple vs Weighted: Scenario Comparison
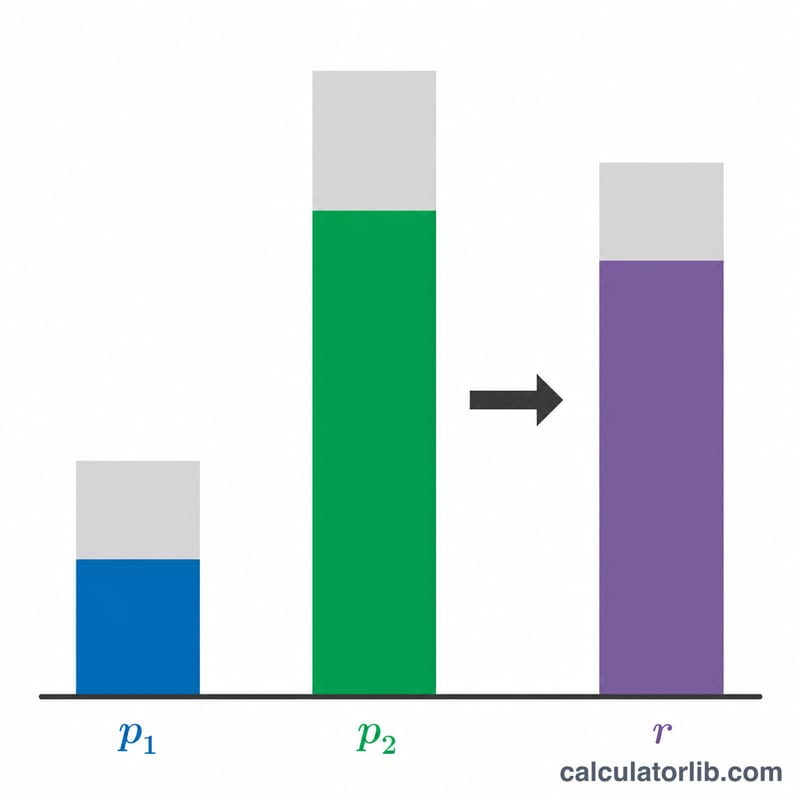
A simple mean treats every percentage as equally important. A weighted average first recovers the underlying counts from each group's total (sample size), so larger groups pull the result toward their percentage. When all groups are the same size the two methods give the same answer; when group sizes differ greatly the gap can be large.
| Scenario | Percentages | Totals (weights) | Simple mean | Weighted average | Notes |
|---|---|---|---|---|---|
| Lopsided groups | 90%, 50% | 1000, 10 | 70% | 89.60% | Big group dominates; simple mean overstates the small group. |
| Equal weights | 80%, 60% | 50, 50 | 70% | 70% | Identical — equal sample sizes make the methods agree. |
| Three test scores | 75%, 85%, 95% | 20, 40, 40 | 85% | 87% | Smaller first group lowers its influence on the combined figure. |
| Pass rates | 40%, 95% | 200, 800 | 67.5% | 84% | Larger high-rate group pulls the overall pass rate up. |
How to Calculate an Average Percentage by Hand
Method 1 — Simple (arithmetic) mean
- Add up all the percentage values: \(\sum P\).
- Count how many percentages you have: \(n\).
- Divide the sum by the count: \(\overline{P} = \dfrac{\sum P}{n}\).
Example: \(\dfrac{90 + 50}{2} = \dfrac{140}{2} = 70\%\). Use this only when every group is the same size or you genuinely want each percentage to count equally.
Method 2 — Weighted average (using totals / sample sizes)
- Convert each percentage to a decimal: \(p_i = P_i / 100\).
- Multiply each decimal by its weight (the group total \(w_i\)) to recover the count that the percentage represents: \(c_i = p_i \times w_i\).
- Sum those recovered counts: \(\sum c_i\).
- Sum the weights (total population): \(\sum w_i\).
- Divide and convert back to a percentage: \(\overline{P}_w = \dfrac{\sum c_i}{\sum w_i} \times 100\).
Example with 90% of 1000 and 50% of 10:
$$\overline{P}_w = \frac{(0.90 \times 1000) + (0.50 \times 10)}{1000 + 10} \times 100 = \frac{900 + 5}{1010} \times 100 = 89.60\%$$Fallback: if you provide no weights, or the number of weights does not match the number of percentages, the calculation falls back to the simple mean — every percentage is then treated as equally weighted.
Key Terms
- Simple (arithmetic) mean
- The sum of all values divided by how many there are, \(\sum P / n\). Each percentage counts equally regardless of the size of the group it came from.
- Weighted average
- A mean in which each value is multiplied by a weight before summing, \(\sum w_i P_i / \sum w_i\). Values backed by larger weights have more influence on the result.
- Weight / total / sample size
- The number that tells you how much each percentage should count — usually the number of items, people, or observations the percentage was measured over (e.g. 1000 students). Larger totals carry more weight.
- Percentage
- A proportion expressed out of 100. A value of 90% equals the decimal 0.90, meaning 90 parts in every 100.
- Combined / overall percentage
- The single percentage you get when all groups are pooled together: total favorable count divided by total population, times 100. The weighted average reproduces this combined figure.
- Why averaging percentages can mislead
- A simple mean of percentages ignores group size, so a tiny group counts as much as a huge one. Averaging 90% of 1000 with 50% of 10 as a plain mean gives 70%, but the true combined rate is 89.6% because almost everyone belongs to the large group. Use weights whenever group sizes differ.
FAQ
When should I weight the percentages? Whenever the percentages come from groups of different sizes — exam scores, survey results across regions, conversion rates by traffic volume.
What if I leave totals blank? The calculator uses the simple arithmetic mean of your percentages.
What if the totals count doesn't match the percentages? The tool falls back to the simple mean to avoid mismatched math.