
What Is Average Variable Cost?
Average variable cost (AVC) measures the variable cost incurred for each unit a business produces. Variable costs are expenses that change with output — raw materials, hourly labor, packaging, and energy used in production. Unlike fixed costs (rent, salaried staff, equipment), variable costs rise and fall with the number of units made. AVC tells you, on average, how much each unit costs in variable terms.
How to Use the Calculator
Enter your total variable cost (the sum of all variable expenses over a period) and the quantity of units produced during that same period. The calculator divides one by the other to return the average variable cost per unit. Keep both figures over the same time window for an accurate result.
The Formula Explained
The formula is simply $$\text{AVC} = \frac{\text{Total Variable Cost}}{\text{Quantity}}$$. Because only variable costs are included, AVC reflects the marginal nature of production spending and is widely used alongside average total cost (ATC) and marginal cost (MC) to evaluate pricing and shutdown decisions. A firm typically continues operating in the short run as long as price covers AVC.
Worked Example
Suppose a workshop spends $10,000 on materials and hourly wages to produce 500 chairs. $$\text{AVC} = \$10{,}000 \div 500 = \$20 \text{ per chair}$$ If each chair sells for more than $20, the business covers its variable costs and contributes toward fixed costs and profit.
AVC Across Production Scenarios
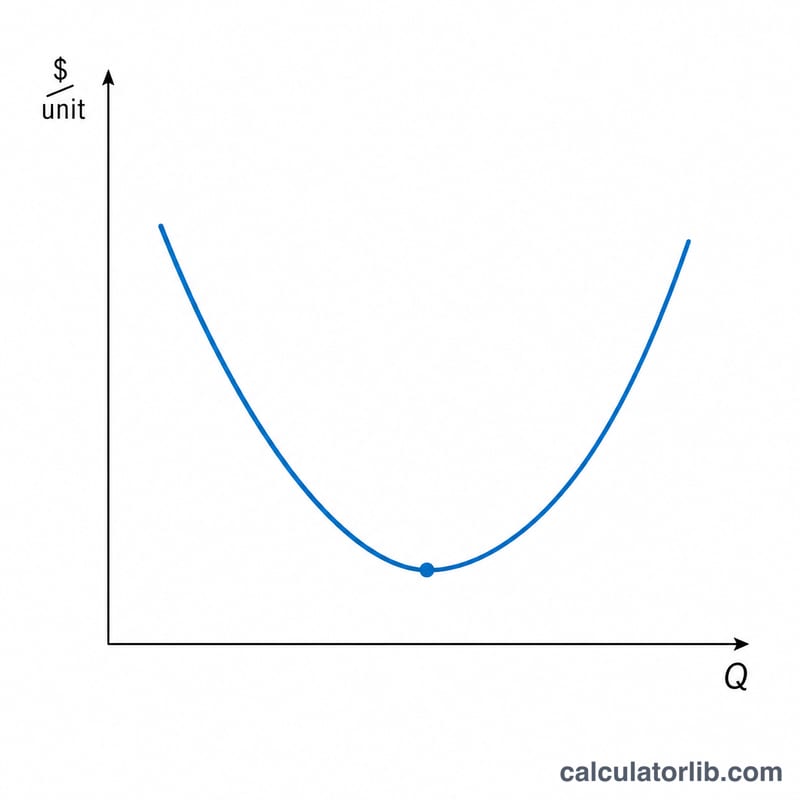
Average variable cost is found by dividing total variable cost (TVC) by the quantity produced: \[\text{AVC} = \frac{\text{Total Variable Cost}}{\text{Quantity}}\] In the short run, AVC typically follows a U-shape. As output rises from low levels, increasing returns and the spreading of variable inputs over more units pull AVC down. Beyond an efficient operating point, diminishing returns and congestion of fixed capacity push AVC back up. The table below illustrates this pattern with a single hypothetical firm.
| Quantity (units) | Total Variable Cost | AVC = TVC ÷ Q | Phase |
|---|---|---|---|
| 100 | $1,200 | $12.00 | High AVC at low output |
| 300 | $2,700 | $9.00 | Falling (economies of scale) |
| 500 | $4,000 | $8.00 | Near minimum AVC |
| 800 | $7,200 | $9.00 | Rising (diminishing returns) |
| 1200 | $13,200 | $11.00 | High AVC (diseconomies) |
Here AVC bottoms out near 500 units at about $8.00 per unit, then climbs again as output is pushed beyond the plant's efficient capacity. The exact minimum point depends on the firm's technology and input prices; the U-shape is the general tendency, not a fixed rule.
Interpreting Your AVC Result
AVC is most useful when read alongside three other numbers: selling price, average total cost (ATC), and marginal cost (MC).
AVC versus selling price — the shutdown point. In the short run a firm should keep operating as long as the price it receives covers its average variable cost. If price is above AVC, every unit sold contributes something toward fixed costs even if total profit is negative. If price falls below AVC, each unit produced loses more than the fixed costs the firm would owe anyway, so the loss-minimizing choice is to shut down production temporarily. The output level where price equals minimum AVC is therefore called the shutdown point.
AVC versus ATC — the fixed-cost gap. Average total cost is the sum of average variable cost and average fixed cost (AFC): \[\text{ATC} = \text{AVC} + \text{AFC}\] The vertical distance between the ATC curve and the AVC curve at any quantity equals AFC. Because fixed costs are spread over more units as output grows, that gap shrinks as quantity rises — the AVC and ATC curves move closer together but never meet.
AVC versus marginal cost. Marginal cost is the change in total cost from producing one more unit. While MC is below AVC, it pulls the average down; while MC is above AVC, it pulls the average up. As a result, the marginal cost curve crosses the AVC curve exactly at AVC's minimum point. The same logic explains why MC also passes through the lowest point of the ATC curve.
This section explains how the AVC figure is typically interpreted in cost analysis; it is general educational information, not personalized financial or business advice. Cost structures vary by firm, and decisions should reflect your own complete data.
FAQ
What counts as a variable cost? Costs that change with output volume — raw materials, direct labor paid per unit or hour, shipping, and utilities tied to production.
How is AVC different from average total cost? ATC includes fixed costs as well; AVC includes only variable costs. \(\text{ATC} = \text{AVC} + \text{average fixed cost}\).
Why does AVC matter? If the selling price falls below AVC, a firm may be better off halting production in the short run because it cannot even cover its variable expenses.