What is OPS?
OPS (On-base Plus Slugging) is a universal sabermetric statistic that measures a baseball batter's overall offensive value in a single number. It is the sum of On-Base Percentage (OBP), which captures how often a hitter reaches base, and Slugging Percentage (SLG), which captures hitting power per at-bat. Because it blends getting on base with extra-base power, OPS correlates strongly with run production and is widely used to compare hitters across teams and eras.
How to use this calculator
Enter the batter's standard counting stats: At Bats (AB), Hits (H), Doubles (2B), Triples (3B), Home Runs (HR), Walks (BB), Hit By Pitch (HBP) and Sacrifice Flies (SF). All values are whole-number counts. The calculator computes singles, total bases, OBP, SLG and OPS automatically and displays each rate to three decimal places.
The formula explained
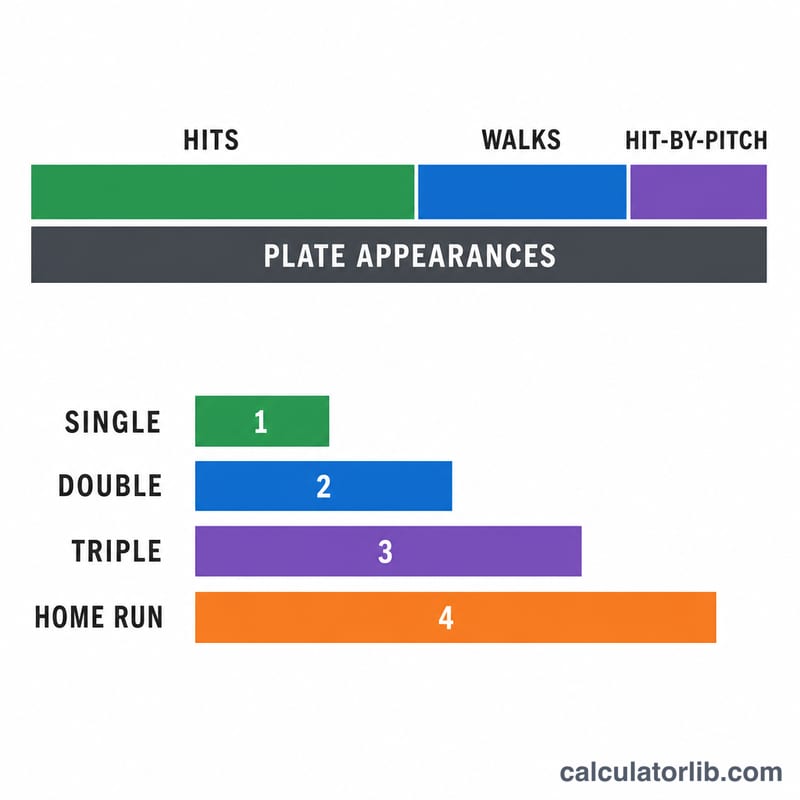
$$\text{OBP} = \frac{\text{H} + \text{BB} + \text{HBP}}{\text{AB} + \text{BB} + \text{HBP} + \text{SF}}$$ Total bases $$\text{TB} = \text{1B} \times 1 + \text{2B} \times 2 + \text{3B} \times 3 + \text{HR} \times 4,$$ where singles \(\text{1B} = \text{H} - \text{2B} - \text{3B} - \text{HR}\). $$\text{SLG} = \frac{\text{TB}}{\text{AB}}.$$ Finally $$\text{OPS} = \text{OBP} + \text{SLG}.$$ The OBP and SLG shown are each rounded to three decimals; OPS is computed from the unrounded OBP and SLG and then rounded, so it can differ slightly from simply adding the displayed components.
Worked example
For a line of AB=311, H=96, 2B=15, 3B=5, HR=28, BB=41, HBP=1, SF=2: singles \(= 96 - 15 - 5 - 28 = 48\); \(\text{TB} = 48 + 30 + 15 + 112 = 205\). $$\text{OBP} = \frac{138}{355} = 0.3887 \rightarrow .389.$$ $$\text{SLG} = \frac{205}{311} = 0.6592 \rightarrow .659.$$ $$\text{OPS} = 0.3887 + 0.6592 = 1.0479 \rightarrow 1.048.$$
OPS Classification Scale
OPS (On-base Plus Slugging) combines a hitter's ability to reach base with their ability to hit for power into a single number. The scale below mirrors the widely cited sabermetric tiers popularized by Bill James and FanGraphs, where roughly .720–.740 represents a typical MLB league average. Use it to translate a raw OPS figure into a quick quality grade.
| OPS Range | Rating | Typical Profile |
|---|---|---|
| 1.000 and above | Excellent | MVP-caliber, elite hitter |
| .900 – 1.000 | Great | All-Star level production |
| .834 – .900 | Above Average | Solid everyday regular |
| .766 – .834 | Average | League-average bat |
| .700 – .766 | Below Average | Useful role player |
| .600 – .700 | Poor | Weak offensive contributor |
| below .600 | Awful | Well below replacement |
These cutoffs are descriptive guidelines, not official rules. Run environments shift over time, so the same OPS can rate slightly higher in a low-offense season and slightly lower in a high-offense season.
Interpreting Your OPS, OBP & SLG
OPS is the sum of two distinct skills, and reading the two components separately tells you more than the combined number alone.
- On-Base Percentage (OBP) measures how often a batter reaches base via a hit, walk, or hit-by-pitch, relative to their plate appearances. It captures plate discipline and contact ability. A typical MLB league-average OBP sits around .320; .350 is good and .400 is elite.
- Slugging Percentage (SLG) measures total bases per at-bat, so it rewards extra-base hits. A single counts 1, a double 2, a triple 3, and a home run 4. League-average SLG is roughly .400; .500 indicates strong power and .550+ is exceptional.
- OPS simply adds the two. League-average OPS generally falls in the .720–.740 range, so a player at .800 is clearly above average and one near .650 is below average.
Because OBP and SLG are added without weighting, two hitters with identical OPS can be very different players. A high-OBP, low-SLG hitter — think a patient leadoff batter with a .390 OBP and .370 SLG (.760 OPS) — gets on base constantly but rarely drives the ball for extra bases. A low-OBP, high-SLG slugger — say .300 OBP and .520 SLG (.820 OPS) — produces fewer baserunners but does far more damage when contact is made. Comparing the two columns shows whether a hitter's value comes from getting on base, from power, or from a balance of both.
One caveat: OPS slightly undervalues OBP relative to its true run-scoring impact, since a point of OBP is worth more than a point of SLG. It remains popular because it is easy to compute from a standard box score and correlates well with team run scoring.
FAQ
What is a good OPS? Around .750 is roughly league average; .900+ is excellent and above 1.000 is elite.
Why isn't OPS just rounded OBP plus rounded SLG? The standard method sums the full-precision values first, then rounds, to avoid compounding rounding error.
Does this work outside the US? Yes. OPS, OBP and SLG are worldwide-standard definitions used in every professional league.