
What Is Fielding Percentage?
Fielding percentage (sometimes written "fielding average") is the standard defensive statistic in baseball and softball that measures how reliably a player or team handles the balls they have a chance to field. It is used identically across professional and amateur leagues worldwide, so this calculator is not region-specific. The value ranges from 0 to 1 and is conventionally displayed to three decimal places, often without the leading zero — for example .984.

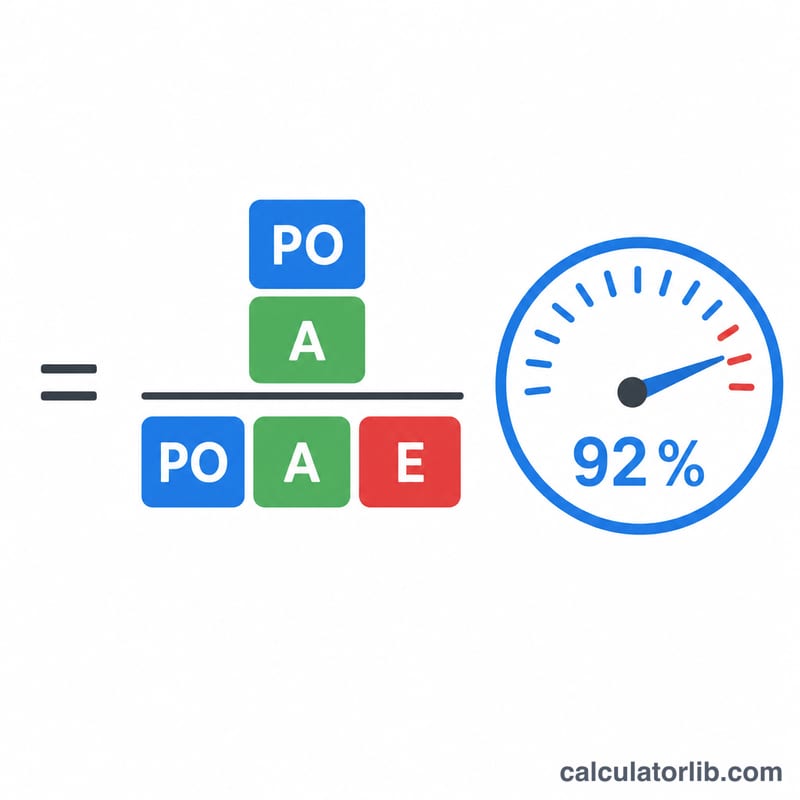
How to Use This Calculator
Enter three whole-number counts: Putouts (outs the fielder personally recorded, such as catching a fly ball), Assists (throws that helped record an out), and Errors (misplays that should have resulted in an out). Press calculate and the tool returns the fielding percentage rounded to three decimals, along with the successful plays and total chances used in the math.
The Formula Explained
The formula is $$\text{FPCT} = \frac{\text{Putouts} + \text{Assists}}{\text{Putouts} + \text{Assists} + \text{Errors}}$$ The numerator counts successful plays; the denominator is "total chances" (TC) — every opportunity the fielder had, whether handled cleanly or not. More errors push the denominator up while leaving the numerator unchanged, lowering the percentage. A fielder who never errs scores a perfect \(1.000\).
Worked Example
Suppose a player records 300 putouts, 470 assists, and 12 errors. Successful plays = \(300 + 470 = 770\). Total chances = \(300 + 470 + 12 = 782\). Fielding percentage = $$\frac{770}{782} = 0.984654\ldots$$ which rounds to \(0.985\) and is shown as .985.
Typical Fielding Percentage by Position
Fielding percentage (FPCT) measures how reliably a defender converts the chances they handle into outs, using the formula:
$$\text{FPCT} = \frac{\text{Putouts} + \text{Assists}}{\text{Putouts} + \text{Assists} + \text{Errors}}$$Average fielding percentage varies by position because of the difficulty and frequency of the plays each position must make. First basemen and catchers handle many routine putouts and post the highest marks, while third basemen and shortstops must make harder throws across longer distances and tend to post the lowest. Pitchers handle relatively few chances. The values below reflect typical modern MLB league averages and are useful as benchmarks.
| Position | Typical League-Average FPCT |
|---|---|
| First base (1B) | .993–.995 |
| Catcher (C) | .992–.995 |
| Outfield (LF/CF/RF) | .985–.990 |
| Pitcher (P) | .955–.970 |
| Second base (2B) | .983–.986 |
| Shortstop (SS) | .970–.978 |
| Third base (3B) | .955–.965 |
Note that a high fielding percentage alone does not fully capture defensive value: a fielder with limited range may avoid errors simply by not reaching difficult balls, while a rangier fielder who reaches more balls may accumulate more errors. FPCT is best read alongside range and chances handled.
How Errors Affect Fielding Percentage
Each error subtracts a successfully handled chance and adds to total chances in the denominator, so even a few errors move the percentage noticeably. The table below holds putouts and assists constant at a combined 250 successful plays (\(\text{PO}+\text{A}=250\)) and varies only the number of errors. Total chances equal \(\text{PO}+\text{A}+\text{E}\), and FPCT is rounded to three decimals.
| Putouts + Assists | Errors | Total Chances | Fielding Percentage |
|---|---|---|---|
| 250 | 0 | 250 | 1.000 |
| 250 | 5 | 255 | .980 |
| 250 | 10 | 260 | .962 |
| 250 | 20 | 270 | .926 |
Worked example with 5 errors:
$$\text{FPCT} = \frac{150 + 100}{150 + 100 + 5} = \frac{250}{255} = 0.9803 \approx .980$$As the table shows, the marginal cost of each error shrinks slightly as total chances grow, but errors remain the only fielder-controlled factor that lowers the percentage. A defender who handles many chances has more room to absorb an occasional miscue, which is one reason high-volume infielders can post strong percentages despite committing several errors over a full season.
FAQ
What is a good fielding percentage? League leaders typically exceed .980, and many infielders and outfielders post numbers above .985. Catchers and first basemen often have the highest values.
What happens if there are zero total chances? If putouts, assists, and errors are all zero, fielding percentage is undefined; this calculator returns 0 rather than dividing by zero.
Does fielding percentage capture range? No. It only reflects the chances a player actually got to. A fielder with limited range may avoid errors and post a high percentage despite fewer plays, which is why advanced metrics supplement it.