
What this calculator does
The Cost of Raising a Child Calculator gives you a quick estimate of how much it will cost to support your child from their current age until they turn 18. It also breaks that figure down into an annual and a monthly amount, and lets you scale the estimate to multiple children. The tool is currency-agnostic — enter your figures in whatever currency you use.
How to use it
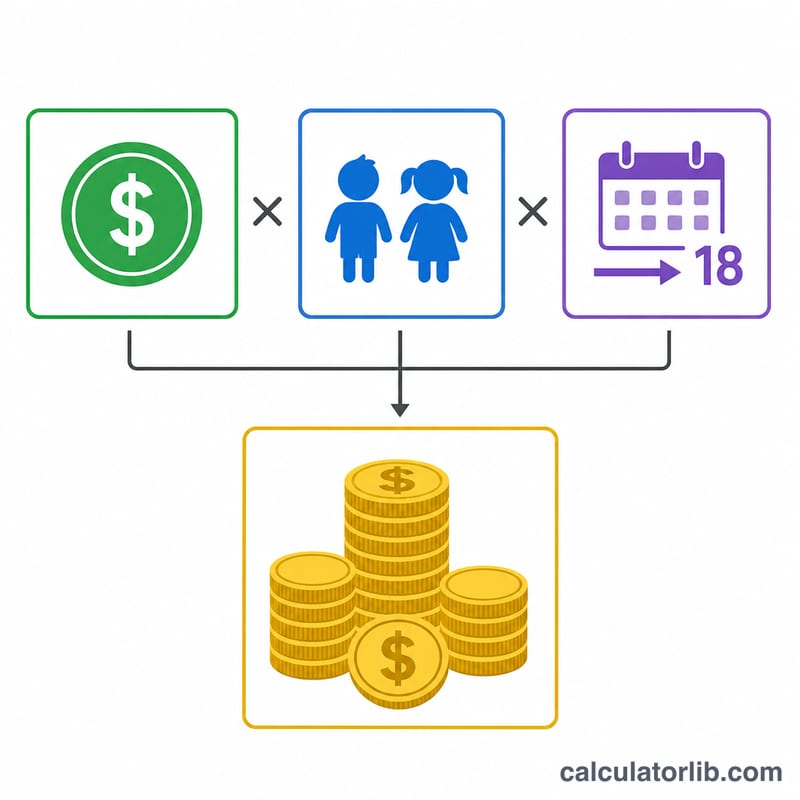
Enter the annual cost per child (food, housing share, clothing, childcare, school costs, activities and so on), your child's current age in whole years, and the number of children you want to include. The calculator multiplies the annual cost by the years that remain before age 18 to project the total, and divides the yearly figure by 12 for a monthly view.
The formula explained
The core equation is simple: $$\text{Total} = \text{Annual Cost} \times \text{Children} \times \left(18 - \text{Current Age}\right)$$ If your child is 5 and you spend 12,000 a year, there are 13 years left until 18, so the projection is \(12{,}000 \times 13 = 156{,}000\). The annual total for all children is Annual Cost × Children, and the monthly figure is that annual total divided by 12. This is a flat-rate model: it assumes costs stay roughly constant in today's money and does not add inflation or interest.
Worked example
Suppose you spend 15,000 per year on one newborn (age 0). Years remaining = 18 − 0 = 18. Total to 18 = $$15{,}000 \times 1 \times 18 = 270{,}000$$ The annual total is 15,000 and the monthly cost is \(15{,}000 \div 12 = 1{,}250\).
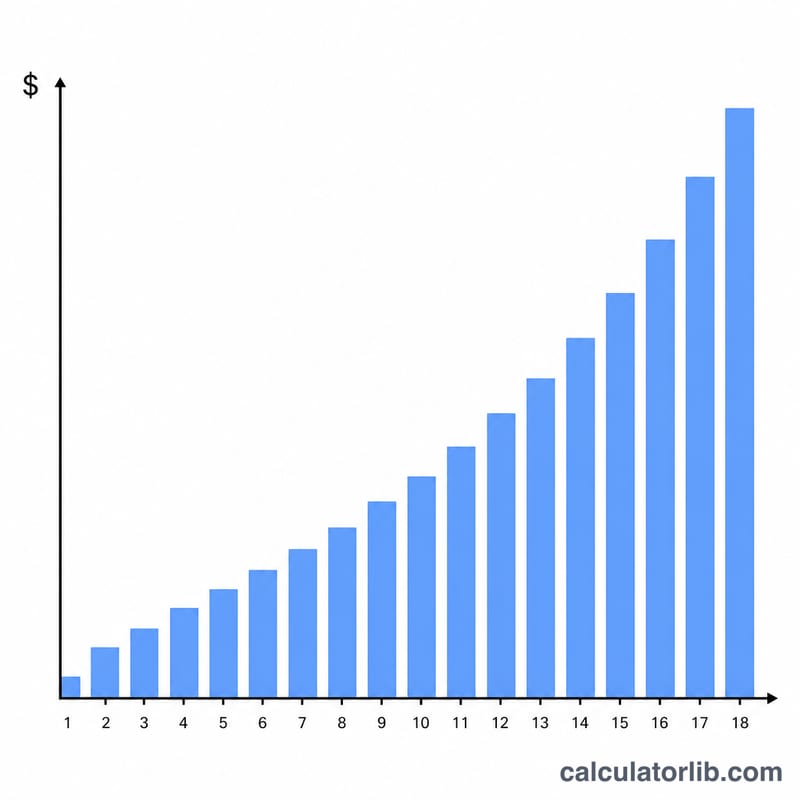
Scenario Comparison: Total Cost by Child's Age and Number of Children
This table uses the calculator's flat-rate formula with a fixed annual cost of 12,000 per child (any currency). Every child is assumed to be the same age. The formula is \(\text{Total to 18} = 12{,}000 \times \text{children} \times (18 - \text{age})\).
| Child's age | Children | Years remaining | Annual total | Monthly total | Total to age 18 |
|---|---|---|---|---|---|
| 0 | 1 | 18 | 12,000 | 1,000 | 216,000 |
| 0 | 2 | 18 | 24,000 | 2,000 | 432,000 |
| 0 | 3 | 18 | 36,000 | 3,000 | 648,000 |
| 5 | 1 | 13 | 12,000 | 1,000 | 156,000 |
| 5 | 2 | 13 | 24,000 | 2,000 | 312,000 |
| 5 | 3 | 13 | 36,000 | 3,000 | 468,000 |
| 10 | 1 | 8 | 12,000 | 1,000 | 96,000 |
| 10 | 2 | 8 | 24,000 | 2,000 | 192,000 |
| 10 | 3 | 8 | 36,000 | 3,000 | 288,000 |
| 15 | 1 | 3 | 12,000 | 1,000 | 36,000 |
| 15 | 2 | 3 | 24,000 | 2,000 | 72,000 |
| 15 | 3 | 3 | 36,000 | 3,000 | 108,000 |
Example: for 2 children aged 0, \(12{,}000 \times 2 \times (18 - 0) = 432{,}000\). Monthly figures are the annual total divided by 12.
Interpreting Your Result
The result is a nominal, constant-money baseline. It multiplies one yearly figure by the number of children and the years left until age 18. It does not include inflation, investment growth or interest, and it does not include higher education or other costs after 18. If prices rise over time, actual spending in later years will be higher in nominal terms than this estimate shows.
The flat-rate formula also treats every year as equally expensive, which real costs usually are not. Childcare tends to be concentrated in the early years. Teenage years can bring different costs, such as food, activities, transport or technology. The total is therefore an average-based approximation, not a year-by-year forecast. When you enter several children, the calculator also applies the same age to all of them.
Be careful about which costs you include in the annual figure. Shared household costs such as housing, utilities and a family car may be only partly attributable to a child. Some would exist anyway, while others rise when a household needs more space. Whether you count them in full, in part or not at all can change the result a lot.
Published national estimates differ by country and methodology. They differ in what they count, which households they cover, how they allocate shared costs and which year's prices they use. Compare any outside figure with your own only after checking how it was defined. Use this output as a planning baseline and replace the annual cost with a figure that reflects your own circumstances and location.
FAQ
Does this include college or university? No. The estimate stops at age 18; add a separate figure if you want to include higher education.
Is inflation included? No — it is a constant, present-value estimate. Real costs typically rise over time, so treat the result as a baseline.
What annual cost should I use? Many families use a figure between 10,000 and 20,000 per year depending on country, childcare and lifestyle. Use your own budget for the most accurate result.