What Is the CTR Calculator?
Click-through rate (CTR) is one of the clearest signals of how compelling your ad, email, or search listing really is. This calculator turns two raw numbers — your clicks and your impressions — into a single percentage that tells you how often people who saw something actually clicked it. It works the same way worldwide and applies to Google Ads, Meta ads, email campaigns, organic search results in Google Search Console, and more.
How to Use It
You only need two inputs:
- Number of Clicks — how many times users clicked your link, ad, or button.
- Number of Impressions — how many times the item was shown (loaded or displayed).
Enter both whole numbers and the tool instantly returns your CTR as a percentage. If impressions are left at zero, the calculator safely returns 0% instead of dividing by zero, so you never get an error.
The Formula Explained
The calculation behind the tool is straightforward:
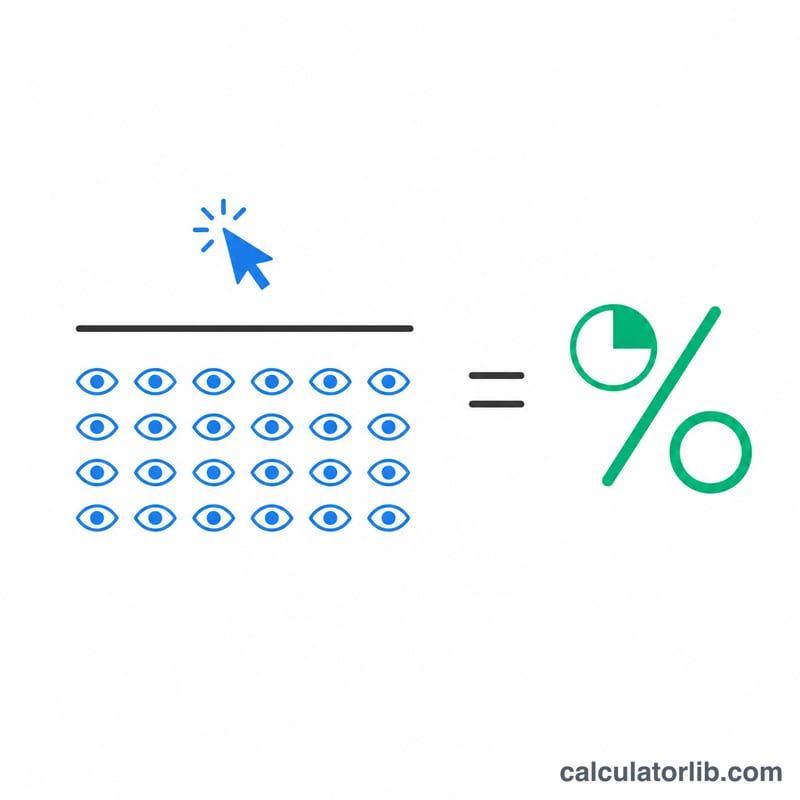
$$\text{CTR} = \frac{\text{Clicks}}{\text{Impressions}} \times 100\%$$Clicks are divided by impressions to get the proportion of viewers who clicked, then multiplied by 100 to express it as a percentage. A higher CTR means your message resonates with the people seeing it.
Worked Example
Suppose your search ad earned 250 clicks from 10,000 impressions. Plug those into the calculator:
- \(250 \div 10{,}000 = 0.025\)
- \(0.025 \times 100 = \textbf{2.5\% CTR}\)
So 2.5% of everyone who saw your ad clicked through. If you doubled clicks to 500 with the same impressions, your CTR would rise to 5%.
Interpreting Your CTR Result
Click-through rate is a ratio of two counts: the clicks recorded on an ad, link or listing divided by the impressions it received, expressed as a percentage.
$$\text{CTR} = \frac{\text{Clicks}}{\text{Impressions}} \times 100\%$$What it measures is relevance of the creative and targeting to the audience that actually saw it — how many of the people shown the message found it interesting enough to click. It does not measure what happened after the click. Conversions, sign-ups, revenue and return on ad spend are separate metrics with separate denominators; a CTR figure alone says nothing about them.
CTR is channel-dependent
- Paid search (Google Ads, Microsoft Advertising): CTR is driven mostly by keyword-to-query intent match and by ad rank/position — the same ad shown at the top of the results page typically earns a multiple of the CTR it earns lower down or on the bottom block.
- Display and programmatic: impressions are served to users who are doing something else, so CTR is inherently one or two orders of magnitude lower than search. Comparing a display CTR against a search CTR is comparing different denominators of attention, not different levels of quality.
- Email: the number depends entirely on the denominator. "Click rate" is usually clicks ÷ delivered emails; "click-to-open rate" (CTOR) is unique clicks ÷ unique opens, and is therefore several times higher for the same campaign. Two reports of the same send can both be correct and differ by a factor of five. Open-based metrics have also been distorted since privacy features such as Apple Mail Privacy Protection began pre-fetching tracking pixels, which inflates opens and deflates CTOR.
- Organic search: in Google Search Console, CTR is clicks ÷ impressions for a query or page, and it falls sharply as average position increases. A page that moves from position 3 to position 8 can lose most of its clicks without losing any impressions.
Volume and targeting move CTR mechanically
Because impressions are the denominator, anything that broadens reach lowers CTR even when the number of interested people is unchanged. Broad match keywords, expanded or lookalike audiences, additional placements and higher frequency caps all add impressions from people with weaker intent. Conversely, narrow branded terms, remarketing lists and high-intent exact-match keywords concentrate impressions on people already looking for you, which raises CTR. A CTR that drops after a targeting expansion is often a sign the expansion worked as designed, not that the creative got worse.
CTR and conversion rate are independent
A low CTR paired with a high conversion rate is common in tightly qualified campaigns: the copy filters out people who would not buy — price, eligibility or geography stated up front — so fewer click but more of those who do convert. That combination can be more profitable than the reverse. A high CTR paired with a poor conversion rate points the other way: creative that promises something the landing page does not deliver, clickbait headlines, misleading pricing, a mismatch between ad and page, or non-human/invalid traffic. Sudden CTR spikes with flat conversions on display and in-app inventory are a recognised signature of click fraud or accidental clicks on poorly placed units.
Small samples are volatile
CTR is a proportion, and proportions computed from few impressions carry wide confidence intervals. One click on 20 impressions is arithmetically 5%, but a single click either way moves it to 0% or 10% — the figure carries almost no information. The uncertainty of an observed rate scales roughly with \(\sqrt{p(1-p)/n}\), so at low CTRs and low impression counts the margin of error can exceed the estimate itself. As a practical matter, a few thousand impressions are usually needed before a search or social CTR is stable enough to compare between variants, and considerably more on display, where CTRs below 1% mean each percentage point rests on very few clicks. Judging an ad, subject line or title tag on the first few dozen impressions measures noise.
Typical CTR Benchmarks by Channel
The ranges below are drawn from published industry benchmark reports — WordStream's Google Ads benchmark studies, Google Ads and Meta advertising benchmarks reported by agencies, Mailchimp's email marketing benchmarks by industry, and organic click curve studies from Advanced Web Ranking and Sistrix. They reflect largely US and Western European advertiser data and are averages across many accounts.
| Channel / Placement | Typical CTR range | Notes |
|---|---|---|
| Google Search ads (all keywords) | ~3–6% | Varies widely by industry; search intent and ad position dominate. Top-of-page placements far outperform the bottom block. |
| Google Search ads — branded keywords | Often 10–20%+ | People searching your brand name already intend to reach you, so branded campaigns routinely report double-digit CTR. |
| Google Display Network | ~0.4–0.6% | Interruptive placements against users engaged in other content; sub-1% is normal and not a fault signal. |
| Meta (Facebook/Instagram) feed ads | ~0.9–1.5% | Link CTR, not "all clicks" (which counts reactions and expands and reads much higher). Check which definition your report uses. |
| LinkedIn ads (sponsored content) | ~0.4–0.6% | Professional targeting with high CPMs; lower CTR is offset by lead quality in B2B. |
| Email marketing — click rate (of delivered) | ~2–5% | Unique clicks ÷ delivered emails. Industry spread is large; transactional and triggered sends run higher than bulk newsletters. |
| Email marketing — click-to-open rate (CTOR) | ~10–20% | Unique clicks ÷ unique opens. Measures content relevance among those who opened; inflated open counts from privacy pre-fetching depress this figure. |
| Organic Google result — position 1 | ~25–30% | Desktop/blended studies; heavily reduced when ads, AI overviews, featured snippets or map packs sit above the result. |
| Organic Google result — position 2 | ~15% | Roughly half of position 1 in most published click curves. |
| Organic Google result — position 3 | ~10% | The decline from 1 to 3 is steeper than from 3 to 6. |
| Organic Google result — below position 10 (page 2+) | Under 2–3% | Impressions still accrue in Search Console, so CTR looks near zero while impression counts stay high. |
These figures move year to year and differ substantially by industry, country, device, seasonality and the methodology of the reporting vendor — the same channel can be quoted at double or half these values by a different source. Treat them as rough orientation for whether your number is in a plausible band, not as targets to hit. The most meaningful comparison is always your own account's history for the same campaign, audience and placement.
CTR Across Common Scenarios
Each row applies the same formula \(\text{CTR} = (\text{Clicks} \div \text{Impressions}) \times 100\%\) to a different pair of inputs. Reading down the table shows how the numerator, the denominator and the sample size each pull the result in a different direction.
| Clicks | Impressions | CTR | What this row illustrates |
|---|---|---|---|
| 250 | 10,000 | 2.50% | Baseline: a typical mid-range search or social campaign week. |
| 500 | 10,000 | 5.00% | Doubling clicks on the same impressions doubles CTR — better creative or a stronger position with unchanged reach. |
| 250 | 25,000 | 1.00% | Same clicks, 2.5× the impressions: broadening match types or audiences dilutes CTR without losing a single click. |
| 40 | 1,200 | 3.33% | A small but usable sample — 40 clicks is enough to see a trend, though variant-vs-variant calls are still shaky. |
| 3 | 60 | 5.00% | Arithmetically identical to row 2, statistically meaningless: one click either way swings it to 3.33% or 6.67%. Too small to act on. |
| 12 | 8,000 (display) | 0.15% | Display inventory: a fraction of a percent is normal for the channel and should not be compared with search rows above. |
| 90 | 450 (email opens) | 20.00% | Denominator change: measured against opens this is click-to-open rate. Against 4,500 delivered emails the same 90 clicks would read 2.00%. |
Three lessons carry across the rows. First, CTR moves for reasons that have nothing to do with creative quality — the denominator is as active a variable as the numerator. Second, the channel sets the scale: 0.15% on display and 5% on branded search can both be healthy. Third, always confirm what the denominator is before comparing two CTR figures, particularly in email, where click rate and click-to-open rate for one campaign differ by roughly an order of magnitude.
Frequently Asked Questions
What is a good CTR? It depends on the channel. Google Search ads often average around 2–5%, display ads under 1%, and email marketing roughly 2–5%. Compare against your own past performance rather than chasing a universal number.
Why is my CTR 0%? Either you recorded no clicks, or your impressions were zero. The calculator returns 0% whenever impressions are zero to avoid an undefined result.
Can CTR be over 100%? Not in normal use — that would mean more clicks than impressions, which usually points to tracking errors, bot traffic, or double-counted clicks. Double-check your data source if you see this.