What this calculator does
The Item Drop Probability Calculator tells you the cumulative chance of receiving at least one rare item after grinding a monster or opening a set of loot boxes a fixed number of times. Games usually advertise a per-attempt drop rate (for example 2%), but that number does not describe your odds over many attempts. This tool converts a single-attempt rate into the realistic probability of success across a whole farming session.
The formula explained
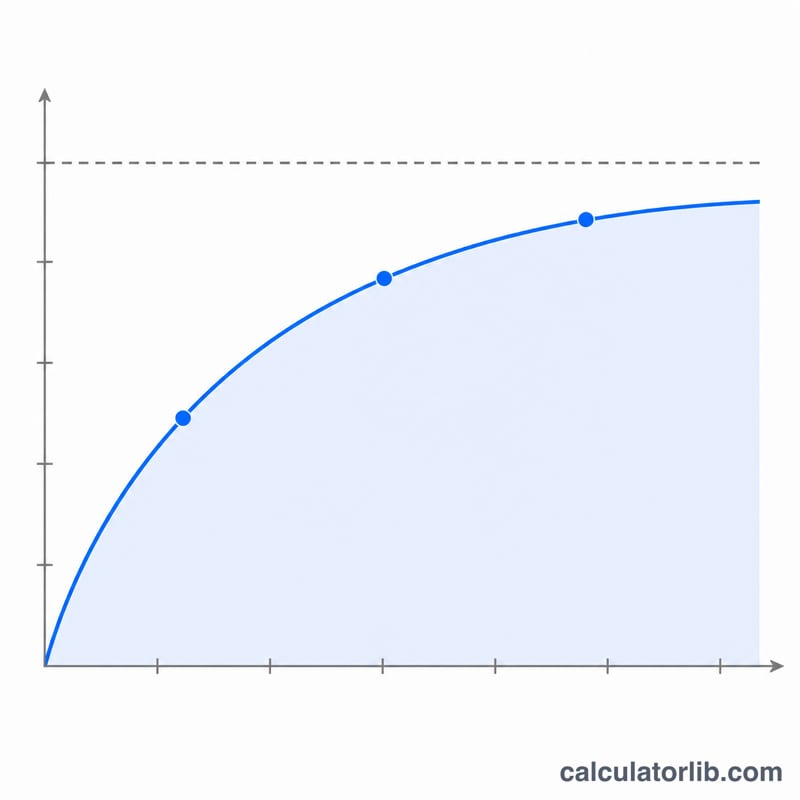
Each attempt is an independent Bernoulli trial with success probability \(p\). The chance of failing one attempt is \(1-p\), so the chance of failing all \(n\) attempts is \((1-p)^n\). The probability of at least one success is the complement:
$$P = 1 - (1 - p)^{n}$$
Here \(p\) = the drop rate per attempt written as a decimal, and \(n\) = the number of attempts. The expected number of drops is simply \(E = n \times p\).

How to use it
Enter the advertised drop rate as a percentage and the number of attempts you plan to make. The calculator returns your cumulative chance of at least one drop, plus the expected total number of drops.
Worked example
Suppose an item drops \(25\%\) of the time and you make \(4\) attempts. Then \(p = 0.25\) and \(n = 4\):
$$P = 1 - (1 - 0.25)^{4} = 1 - 0.75^{4} = 1 - 0.316406 = 0.683594$$
So you have about a \(68.36\%\) chance of getting the item at least once.
Drop Chance Across Common Drop Rates and Attempt Counts
Each cell shows the chance of getting at least one drop, \(P = 1-(1-p)^n\), as a percentage. It assumes every attempt is independent with the same drop rate. Values are rounded to two decimals, so 100.00% means "above 99.995%", not a literal guarantee.
| Drop rate | 10 attempts | 50 attempts | 100 attempts | 300 attempts | 1000 attempts |
|---|---|---|---|---|---|
| 0.1% | 1.00% | 4.88% | 9.52% | 25.93% | 63.23% |
| 0.5% | 4.89% | 22.17% | 39.42% | 77.77% | 99.33% |
| 1% | 9.56% | 39.50% | 63.40% | 95.10% | 100.00% |
| 2% | 18.29% | 63.58% | 86.74% | 99.77% | 100.00% |
| 5% | 40.13% | 92.31% | 99.41% | 100.00% | 100.00% |
| 10% | 65.13% | 99.48% | 100.00% | 100.00% | 100.00% |
Example: a 1% drop over 100 attempts gives \(1-(0.99)^{100} \approx\) 63.40%. A 0.5% drop over 300 attempts gives about 77.77%.
Attempts Needed for a Target Confidence
To find how many attempts you need for a target probability \(P\) (as a decimal, e.g. 0.90) with per-attempt drop rate \(p\) (as a decimal, e.g. 0.01):
- Convert percentages to decimals: a 1% rate is \(p = 0.01\), and a 90% target is \(P = 0.90\).
- Compute \(1-P\) and \(1-p\). For this case, \(1-P = 0.10\) and \(1-p = 0.99\).
- Take natural logs and divide: $$n = \frac{\ln(1-P)}{\ln(1-p)}$$
- Round up to the next whole attempt, because you cannot make a fraction of an attempt and rounding down would fall just short of the target.
Shortcut for small \(p\): since \(\ln(1-p) \approx -p\), we get \(n \approx \frac{0.693}{p}\) for a 50% chance and \(n \approx \frac{2.303}{p}\) for a 90% chance.
Example (1% drop rate):
- 50%: \(n = \frac{\ln 0.5}{\ln 0.99} = \frac{-0.6931}{-0.01005} \approx 68.97\), so 69 attempts. The shortcut gives \(0.693/0.01 = 69.3\).
- 90%: \(n = \frac{\ln 0.1}{\ln 0.99} = \frac{-2.3026}{-0.01005} \approx 229.1\), so 230 attempts. The shortcut gives \(2.303/0.01 = 230.3\).
For a 0.5% drop rate and a 90% target: \(\frac{2.3026}{0.005013} \approx 459.4\), so about 460 attempts.
Interpreting Your Drop Probability
- Expected attempts is not a guarantee. If you make \(n = 1/p\) attempts (for example 100 attempts at 1%), the chance of at least one drop is \(1-(1-p)^{1/p} \approx 1 - 1/e \approx 63.2\%\), not 100%. That leaves roughly a 36.8% chance of coming away with nothing.
- Bad-luck streaks are normal. With independent attempts, past failures do not raise the odds of the next try. Going 2–3 times the expected number of attempts without a drop happens regularly across many players. At \(n = 2/p\) about 13.5% of players still have nothing, and at \(n = 3/p\) about 5%.
- It is a probability, not a prediction. The result describes how likely at least one success is across many hypothetical runs. It cannot say which attempt will succeed or whether yours will.
- Model assumptions. The formula assumes a fixed, independent drop rate on every attempt. Games with pity counters, bad-luck protection, guaranteed drops after a threshold, or drop rates that change with level or luck stats will differ from this model. Usually they make the real odds better than the formula shows.
- Check the rate. Published or community-estimated drop rates may be approximate, so treat the output as an estimate.
FAQ
Does more attempts guarantee a drop? No. As \(n\) grows the probability approaches but never reaches 100%, so a drop is never guaranteed.
Why is my chance lower than rate times attempts? Multiplying rate by attempts counts overlapping successes; the correct model uses the complement of all failures, which is always at most 100%.
Are drops independent? This model assumes each attempt is independent with the same drop rate, which matches most games without pity systems.