What is the PM2.5 to AQI Calculator?
This tool converts a fine-particulate-matter (PM2.5) concentration, measured in micrograms per cubic meter (µg/m³), into the United States Environmental Protection Agency (US EPA) Air Quality Index (AQI). The AQI is a 0–500 scale that translates pollution levels into an easy-to-understand health indicator. This calculator uses the official US EPA breakpoints (2024 revised values for PM2.5) and applies only to the US AQI standard — other countries use different scales.
How to use it
Enter the measured 24-hour average PM2.5 concentration in µg/m³ and the calculator returns the corresponding AQI number and its health category (Good, Moderate, Unhealthy for Sensitive Groups, Unhealthy, Very Unhealthy, or Hazardous).
The formula explained
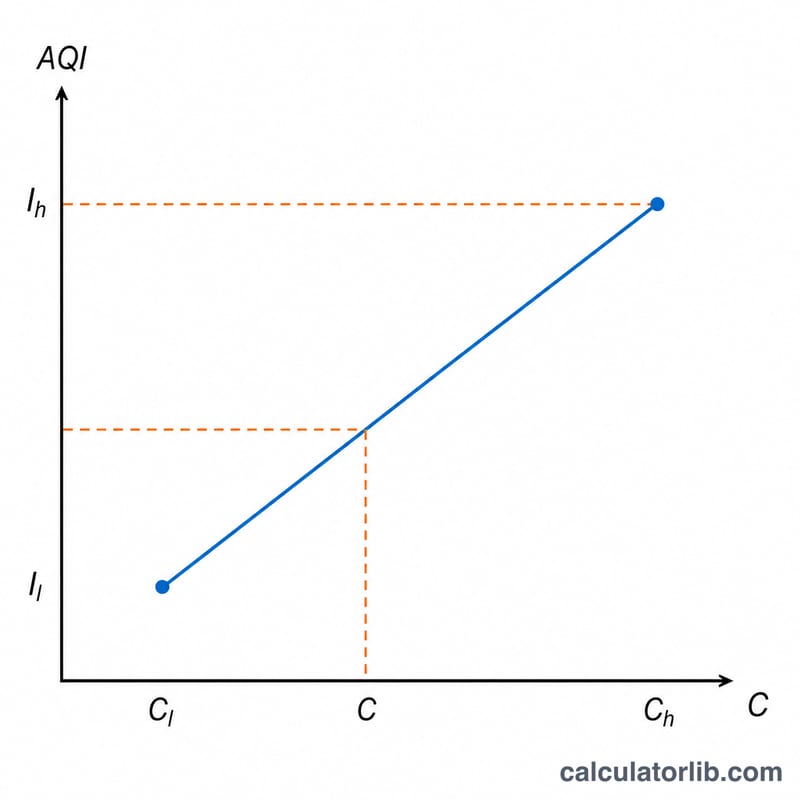
The EPA defines a set of concentration breakpoints, each mapped to an AQI range. The calculator finds the breakpoint interval that contains your concentration \(C\), then linearly interpolates:
$$\text{AQI} = \frac{I_h - I_l}{C_h - C_l}\,(C - C_l) + I_l$$
Here \(C_l\) and \(C_h\) are the low and high concentration breakpoints bracketing \(C\), and \(I_l\) and \(I_h\) are the matching AQI values. The result is rounded to the nearest whole number.
Worked example
Suppose PM2.5 = 35.5 µg/m³. This falls in the 35.5–55.4 band, which maps to AQI 101–150. So \(C_l=35.5\), \(C_h=55.4\), \(I_l=101\), \(I_h=150\). $$\text{AQI} = \frac{150 - 101}{55.4 - 35.5}\,(35.5 - 35.5) + 101 = 0 + 101 = \mathbf{101}$$ in the "Unhealthy for Sensitive Groups" category.
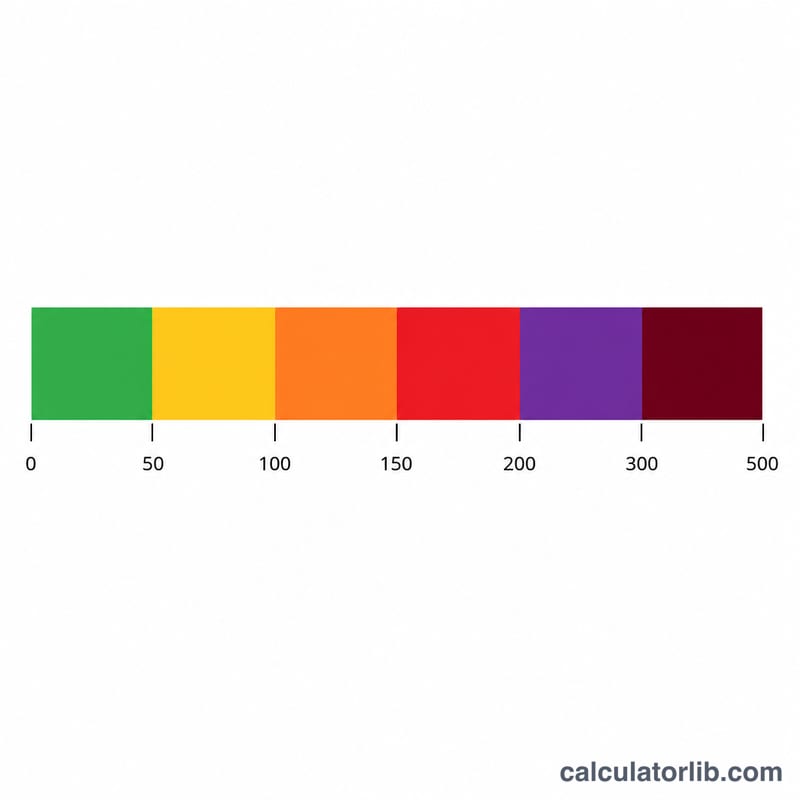
What Your AQI Result Means
The US EPA Air Quality Index runs on a 0–500 scale, where higher numbers mean greater air pollution and greater health concern. An AQI of 100 corresponds to the level of the relevant short-term national air quality standard; values at or below 100 are generally considered satisfactory, while values above 100 are considered unhealthy — first for sensitive groups, then, as the number rises, for everyone.
- Good (0–50): Air quality is satisfactory and air pollution poses little or no risk.
- Moderate (51–100): Air quality is acceptable. There may be a risk for some people, particularly those who are unusually sensitive to air pollution.
- Unhealthy for Sensitive Groups (101–150): Members of sensitive groups may experience health effects. The general public is less likely to be affected.
- Unhealthy (151–200): Some members of the general public may experience health effects; members of sensitive groups may experience more serious effects.
- Very Unhealthy (201–300): Health alert — the risk of health effects is increased for everyone.
- Hazardous (301–500): Health warning of emergency conditions — everyone is more likely to be affected.
For PM2.5, "sensitive groups" as defined by EPA include people with heart or lung disease, older adults, children and teenagers, and people of lower socioeconomic status. This is general factual information about the index and is not personal medical advice; consult a qualified professional regarding individual health concerns.
Key Terms
- PM2.5
- Fine particulate matter with an aerodynamic diameter of 2.5 micrometers or smaller. These particles are small enough to penetrate deep into the lungs and enter the bloodstream.
- AQI (Air Quality Index)
- The US EPA's 0–500 index that translates measured pollutant concentrations into a single number describing air quality and associated health concern.
- µg/m³ (micrograms per cubic meter)
- The unit of mass concentration used for PM2.5: the mass of particulate matter, in micrograms, contained in one cubic meter of air.
- Breakpoint
- A defined endpoint of a concentration or AQI band in the EPA lookup table. Breakpoints divide the scale into the six categories and anchor the linear interpolation.
- Sensitive groups
- People at higher risk from a given pollutant. For PM2.5 this includes people with heart or lung disease, older adults, children, and teenagers.
- \(C\)
- The measured (truncated) PM2.5 concentration being converted, in µg/m³ — entered in the pm25 field.
- \(C_l\) and \(C_h\)
- The low and high concentration breakpoints of the category that contains \(C\) (in µg/m³).
- \(I_l\) and \(I_h\)
- The low and high AQI index values corresponding to \(C_l\) and \(C_h\) for that same category.
FAQ
Does a higher AQI always mean worse air? Yes — higher AQI means more pollution and greater health risk.
What concentration is "Good"? Under the 2024 EPA scale, PM2.5 from 0–9.0 µg/m³ maps to AQI 0–50 (Good).
Is this the same as the international AQI? No. This uses US EPA breakpoints; the EU, India, China and others use different bands and indices.