
What Is Attrition Rate?
The attrition rate (also called the turnover rate) measures the percentage of employees who leave an organization over a given period — typically a month, quarter, or year. It is one of the most watched metrics in HR and people analytics because high attrition signals problems with engagement, compensation, management, or culture, and it directly drives recruiting and training costs.
How to Use This Calculator
Enter the number of employees who left during the period and your average number of employees over that same period. The calculator returns the attrition rate as a percentage, plus the corresponding retention rate. Be consistent with the period: if you count departures over a year, use the average headcount across that year.
The Formula Explained
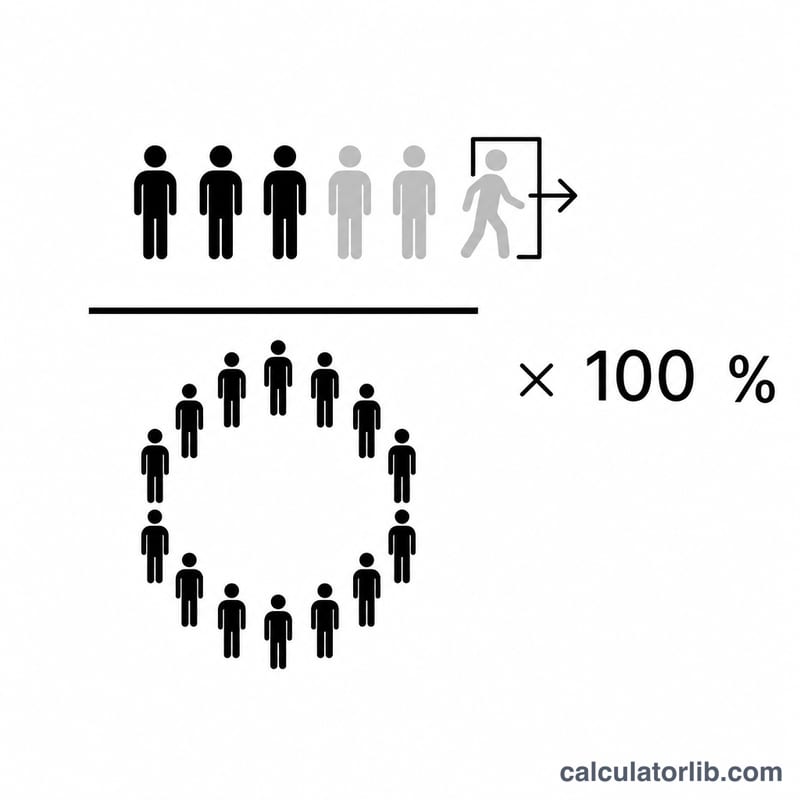
The calculation is straightforward:
$$\text{Attrition Rate} = \frac{\text{Employees Left}}{\text{Avg Employees}} \times 100\%$$
Average employees is usually computed as \((\text{beginning headcount} + \text{ending headcount}) \div 2\). Dividing departures by this average and multiplying by 100 converts the ratio into an easy-to-compare percentage. Retention rate is simply 100 minus the attrition rate.
Worked Example
Suppose 15 employees left during the year and your average headcount was 200. The attrition rate is $$(15 \div 200) \times 100 = 7.5\%.$$ That means 7.5% of your workforce departed, while your retention rate was 92.5%.
Typical Attrition Rate Benchmarks by Industry
Attrition (or turnover) rates vary widely by industry, role type, region and economic conditions. The ranges below are general benchmarks drawn from common HR reporting patterns — they are useful as rough orientation, not absolute standards. A figure outside a range is not automatically "bad"; it should always be read against your own historical trend and direct competitors.
| Industry | Typical annual attrition range | Notes |
|---|---|---|
| Technology / software | 13% – 20% | Higher for engineering talent in competitive markets |
| Retail | 30% – 60%+ | Driven by seasonal and part-time, hourly roles |
| Hospitality / food service | 40% – 70%+ | Among the highest of any sector |
| Healthcare | 18% – 30% | Varies sharply by role (nursing vs. admin) |
| Manufacturing | 15% – 25% | Plant/line roles tend to be higher than salaried |
| Finance / banking | 10% – 18% | Generally lower; higher in front-office sales roles |
| Professional services | 12% – 20% | Up-or-out cultures can raise junior attrition |
For example, if 14 people left a technology team that averaged 100 employees over the year, the attrition rate is 14% — squarely within the typical technology range, suggesting nothing unusual at the headline level.
Interpreting Your Attrition Rate
Attrition rate is the share of your workforce that left over a period, calculated as employees who left divided by average headcount, times 100. The number itself is only a starting point — interpretation depends on context.
- Low rate (well below your industry norm) usually signals stability, but extremely low attrition can also indicate stagnation, blocked promotion paths, or a workforce that is not refreshing skills.
- Moderate rate (around your industry norm) is generally considered healthy — it allows natural renewal without excessive disruption or rehiring cost.
- High rate (well above your industry norm) often points to problems with pay, management, workload, culture or onboarding, and tends to drive up recruiting and training costs.
Healthy vs. problematic turnover. Not all departures are equal. Healthy turnover includes retirements, planned exits, and the departure of underperformers — this can improve team quality. Problematic attrition is the loss of high performers and regretted leavers, especially early-tenure employees. Two companies can report the same 18% and be in completely different positions depending on who left. Segmenting voluntary vs. involuntary, and regretted vs. non-regretted, matters more than the single headline figure.
Read it alongside retention. Attrition and retention are complementary: retention rate \(= 100\% - \text{attrition rate}\) for a stable headcount. A 15% attrition rate corresponds to roughly an 15% loss and about 85% retention. Looking at both keeps the focus on the people who stay, not only those who leave, and helps you see whether a high rate is concentrated in a few teams or spread evenly.
Compare to norms, not a universal target. There is no single "good" number that applies to every employer. A 25% rate may be excellent for hospitality and alarming for finance. Always benchmark against (1) your own trend over time, (2) your specific industry and region, and (3) the rate by department, tenure and performance level. A rising trend versus your own history is usually a more reliable warning sign than any cross-industry rule of thumb.
FAQ
What is a good attrition rate? It varies by industry, but many organizations aim for an annual rate below 10%. Some high-turnover sectors like retail and hospitality routinely see much higher figures.
Does this include voluntary and involuntary departures? The basic formula counts all separations. For deeper analysis, calculate voluntary and involuntary attrition separately.
How do I find average employees? Add the headcount at the start and end of the period and divide by two, or average monthly headcounts for more accuracy.