What This Calculator Does
The Average Illuminance Calculator uses the lighting industry's lumen method to estimate the average maintained light level (in lux) produced by a set of fixtures over a given floor area. It is widely used in lighting design to check whether a room meets recommended illuminance targets — for example, 300–500 lux for offices, 150 lux for corridors, or 750 lux for detailed tasks.
How to Use It
Enter the number of fixtures, the rated lumen output per fixture, the coefficient of utilization (CU), the light loss factor (LLF), and the room area in square meters. The calculator returns the average illuminance in lux along with the total and effective lumens reaching the work plane.
The Formula Explained
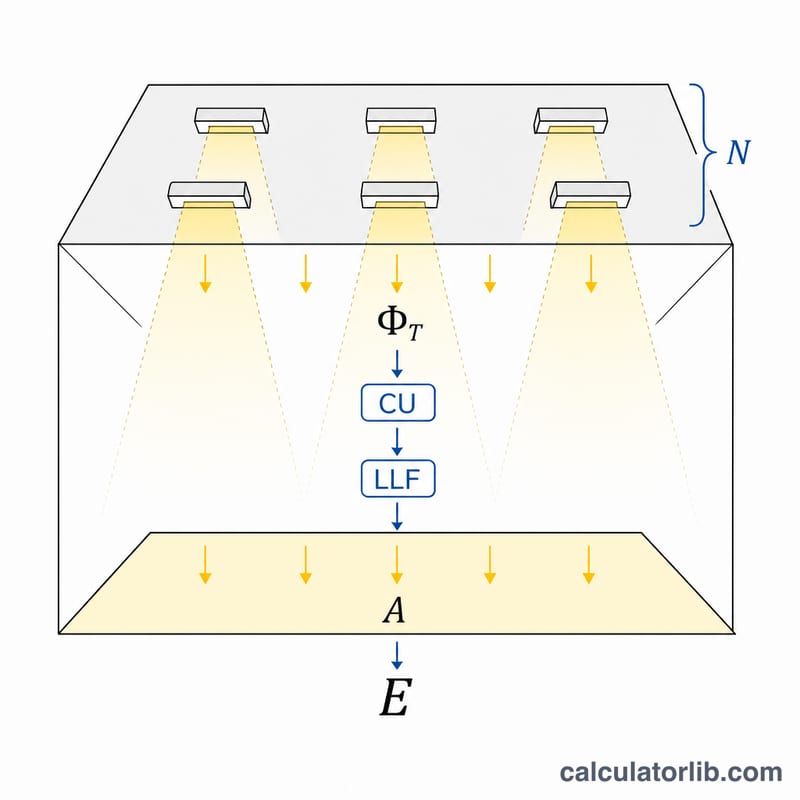
The equation is $$E = \frac{\text{N} \times \text{Lumens} \times \text{CU} \times \text{LLF}}{\text{Area}}$$ where:
N is the number of fixtures (luminaires). Lumens is the rated output of each fixture. CU (coefficient of utilization, 0–1) accounts for how much light actually reaches the work plane based on room geometry and surface reflectances. LLF (light loss factor, 0–1) accounts for lamp lumen depreciation and dirt accumulation over time. Area is the illuminated surface in square meters. The result is in lux, where 1 lux = 1 lumen per square meter.
Worked Example
Suppose a room has 10 fixtures, each rated at 3,000 lumens, with CU = 0.6, LLF = 0.8, over a 50 m² floor. Total lumens = \(10 \times 3{,}000 = 30{,}000\) lm. Effective lumens = \(30{,}000 \times 0.6 \times 0.8 = 14{,}400\) lm. Average illuminance = \(14{,}400 / 50 =\) 288 lux.
Recommended Illuminance Levels by Space
The table below lists typical maintained illuminance levels (the average lux that should be present at the end of the maintenance cycle, just before cleaning or relamping). Values are drawn from the European standard EN 12464-1 (lighting of indoor work places) and the North American IESNA recommendations. Use these as design targets for the lumen method.
| Space / task | Maintained illuminance (lux) | Notes |
|---|---|---|
| Corridors, circulation areas | 100–150 | Transition zones, low task demand |
| Stairs, escalators | 100–150 | Higher uniformity at level changes |
| Warehouse storage (low activity) | 100–200 | Higher if continuously staffed |
| Lobbies, foyers, canteens | 200 | General amenity lighting |
| General offices, classrooms | 300–500 | EN 12464-1: 500 lx on the working plane |
| Reading, writing, computer work | 500 | Standard office task level |
| Retail sales floor | 300–500 | Accent lighting adds local highlights |
| Drawing offices, technical drawing | 750 | Fine detail and contrast |
| Detailed / precision tasks | 750–1000 | Inspection, fine assembly, electronics |
| Very fine work (jewellery, surgery prep) | 1000–2000+ | Often supplemented by local task lighting |
Standards specify the value on the relevant task plane (commonly 0.75 m above the floor for seated work). When you target, for example, 500 lx in an office, the lumen-method average you compute should meet or modestly exceed that figure to allow for the value declining toward the maintained level over time.
Typical CU and LLF Values
The lumen-method equation \(E = \dfrac{N \times \Phi \times CU \times LLF}{A}\) depends on two correction factors. The coefficient of utilization (CU) is the fraction of bare-lamp lumens that actually reaches the working plane; it rises with larger, more proportioned rooms and brighter surface reflectances. The light loss factor (LLF) accounts for lumen output dropping below initial values over the maintenance cycle.
Typical CU values
| Room proportion | Surface reflectances (ceiling/wall) | Typical CU |
|---|---|---|
| Small / narrow room | Low (50% / 30%) | 0.35–0.45 |
| Medium room | Medium (70% / 50%) | 0.50–0.65 |
| Large / well-proportioned room | High (80% / 50%) | 0.65–0.80 |
Higher, narrower rooms lose more light to the walls and have a lower CU; wide, low rooms with light-coloured surfaces approach the upper values. Manufacturers publish CU tables indexed by the room cavity ratio and reflectances for each luminaire.
Typical LLF components
The total LLF is the product of its recoverable and non-recoverable components, most importantly lamp lumen depreciation (LLD) and luminaire dirt depreciation (LDD):
| Environment | LLD (lamp depreciation) | LDD (dirt depreciation) | Combined LLF |
|---|---|---|---|
| Clean (offices, clean rooms) | 0.90–0.95 | 0.90–0.95 | 0.80–0.90 |
| Normal (schools, shops, light industry) | 0.85–0.90 | 0.80–0.85 | 0.70–0.80 |
| Dirty (workshops, foundries, dusty stores) | 0.80–0.85 | 0.65–0.75 | 0.55–0.65 |
Modern LED luminaires depreciate slowly, so an LLF of 0.80 is a common default for clean indoor spaces; use a lower value where cleaning is infrequent or the atmosphere is dusty.
FAQ
What is a typical CU value? CU ranges roughly from 0.4 (dark rooms or deep cavities) to 0.8 (bright, well-proportioned rooms). Manufacturers publish CU tables for each luminaire.
What LLF should I use? A common starting value is 0.7–0.85, combining lamp depreciation and dirt; clean environments use higher values.
Does this give footcandles? No — the result is in lux. To convert to footcandles, divide lux by 10.764.