What is the Biorhythm Compatibility Calculator?
This is a universal, pseudo-scientific tool that compares the classic three biorhythm cycles of two people: Physical (23 days), Emotional/Sensitivity (28 days), and Intellectual (33 days). It reports a compatibility value from 0 to 1 for each cycle based on the gap between the two birthdays, and draws a chart of the difference between the two people's biorhythm waves over roughly one month. The math is the same everywhere; the optional Japanese-era year entry (Meiji, Taisho, Showa, Heisei, Reiwa) is offered purely as a convenience and is valid only from 1873 onward.
How to use it
Enter each person's birthday (year, month, day) and a base date for the graph. For most users, leave the era dropdown on "Western (Gregorian)" so the typed year is the full year (e.g. 1990). Submit to see three compatibility numbers plus a difference graph.
The formula explained
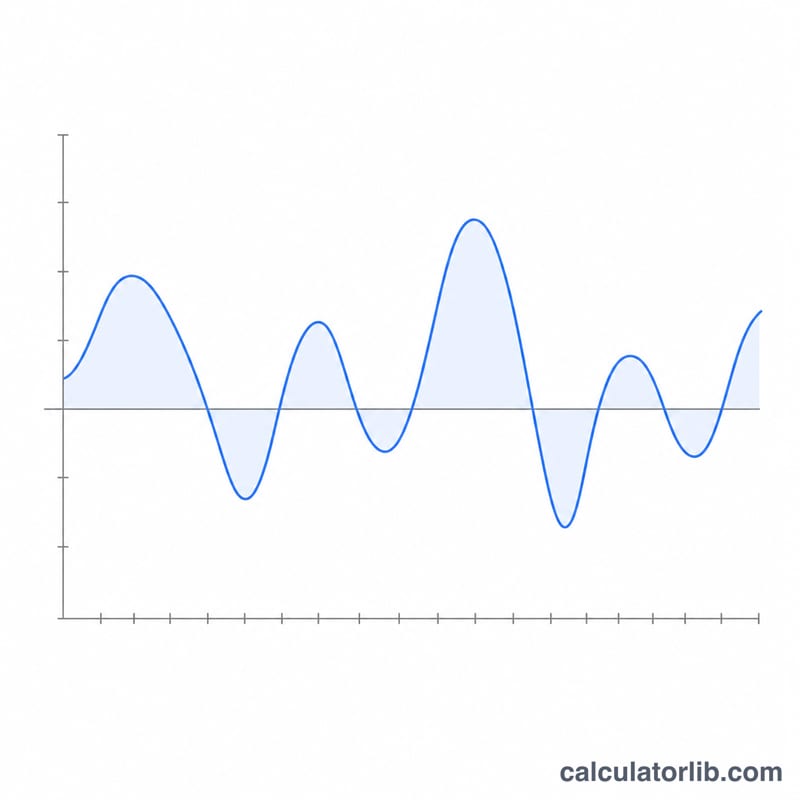
Each calendar date is converted to a Julian Day Number (JDN) so day gaps are exact. Let \(t\) be the day gap between the two birthdays. For each cycle period \(T\), compatibility = \(\left|\cos\!\left(\frac{\pi \cdot t}{T}\right)\right|\). A value near 0 means the two rhythms are well matched; near 1 means they are out of sync. The graph value for day \(k\) is $$\frac{\sin\!\left(\frac{2\pi \cdot t_1}{T}\right) - \sin\!\left(\frac{2\pi \cdot t_2}{T}\right)}{2},$$ where \(t_1\) and \(t_2\) are each person's age in days at that day.
Worked example
Self born 1990-06-15, partner born 1992-09-20. JDN gap $$t = 2448058 - 2448886 = -828 \text{ days}.$$ Physical = \(\left|\cos\!\left(\frac{\pi \cdot 828}{23}\right)\right| = \left|\cos(36\pi)\right| = 1.0\) (out of sync). Emotional = \(\left|\cos\!\left(\frac{\pi \cdot 828}{28}\right)\right| \approx 0.2225\) (well matched). Intellectual = \(\left|\cos\!\left(\frac{\pi \cdot 828}{33}\right)\right| \approx 0.9594\) (out of sync).
Biorhythm Cycle Constants
Classic biorhythm theory models three independent sine waves that all start at the moment of birth. Each wave has a fixed period measured in days. This calculator uses these standard periods to score how closely two people's cycles line up:
| Cycle | Period (P) | What it traditionally represents |
|---|---|---|
| Physical | 23 days | Strength, energy, stamina, coordination |
| Emotional (Sensitivity) | 28 days | Mood, sensitivity, creativity, intuition |
| Intellectual | 33 days | Alertness, memory, logic, analytical ability |
To measure the exact gap between two birthdays, the tool converts each date to its Julian Day Number (JDN) — a continuous integer count of days that ignores months and leap-year boundaries. The day gap is simply
$$t = \text{JDN}_{\text{self}} - \text{JDN}_{\text{partner}}$$
Because the JDN advances by exactly 1 each calendar day, this difference automatically handles different month lengths and leap years, giving a whole-number count of days between the two dates. The compatibility for each cycle is then
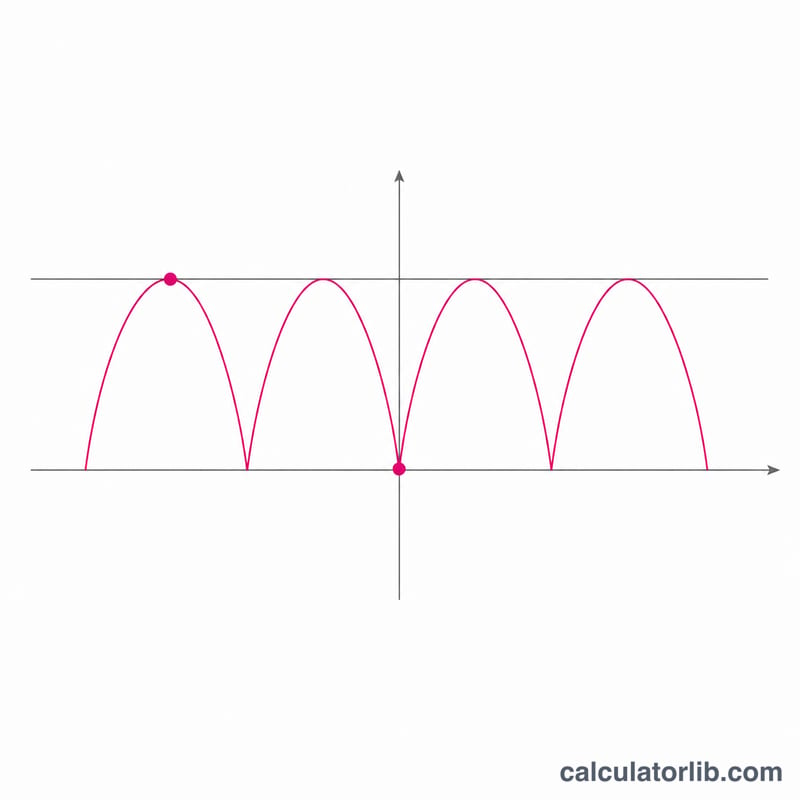
$$\text{Compatibility} = \left| \cos\!\left( \frac{\pi\, t}{P} \right) \right|$$
where \(P\) is 23, 28 or 33 depending on the cycle. The result always lands between 0 and 1.
Interpreting Your Compatibility Scores
Each cycle returns a number between 0 and 1. Counterintuitively, in this tool a value near 0 is the strongest match and a value near 1 is the weakest. Here is why.
The score is \(\left|\cos(\pi t / P)\right|\). When the day gap \(t\) is a quarter of a cycle (about \(P/4\) days, or any odd multiple of it), the cosine is 0 — the two people's waves are roughly 90° apart. In biorhythm tradition this quarter-phase offset is treated as the matched or complementary state, where one partner is rising while the other steadies them. When \(t\) is a whole or half cycle, the cosine reaches \(\pm 1\), the waves are in step (0° or 180° apart), and the score is 1 — labelled here as out of sync.
| Score | Phase gap | Reading |
|---|---|---|
| 0.00 – 0.20 | Near 90° | Strongly matched / complementary |
| 0.20 – 0.50 | Moderate | Fairly compatible |
| 0.50 – 0.80 | Moderate | Mixed |
| 0.80 – 1.00 | Near 0° or 180° | Out of sync |
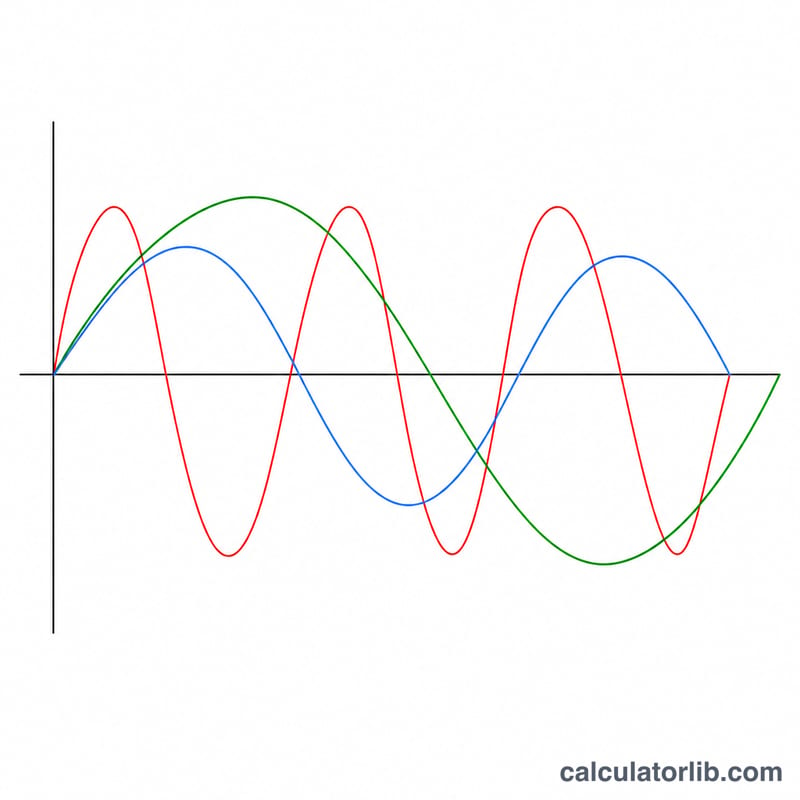
Reading the difference graph: the one-month graph plots each person's three waves around a chosen base date. Where two curves of the same colour cross near the centreline, the cycles are about a quarter-phase apart (a strong-match day); where they rise and fall together or mirror each other exactly, that cycle is in step and the daily score is high. Watching the curves over the month shows how the matched and out-of-sync days alternate as the cycles drift relative to one another.
Please note: biorhythm theory has no scientific validity. Controlled studies have never found that 23-, 28- and 33-day cycles predict mood, performance or relationship outcomes. These scores are for entertainment and curiosity only and should not be used to make real decisions about health, relationships or anything else.
FAQ
Is biorhythm scientific? No. It is a fixed, well-known set of sine cycles with no proven predictive value; treat it as entertainment.
Why is "well matched" near 0, not near 1? The compatibility value measures the cosine of the phase gap. When it is small the two waves are 90 degrees apart, which the source defines as matched.
What does the graph show? The difference (self minus partner, divided by 2) of each wave. Near +1 you peak while your partner is low; near -1 the reverse; near 0 you are aligned.