What This Calculator Does
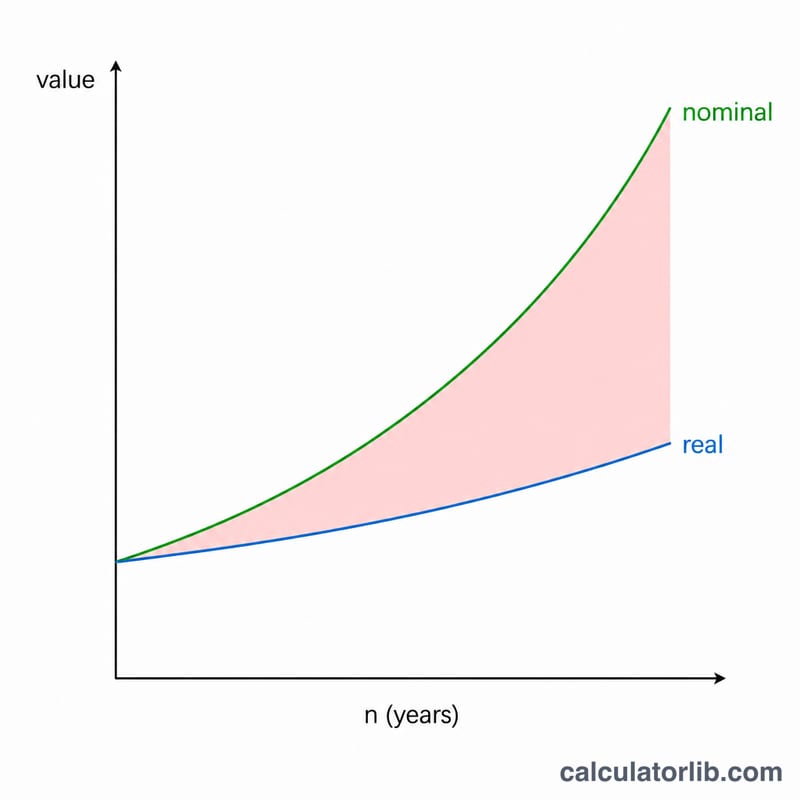
This calculator shows the real, inflation-adjusted future value of money you invest today. A balance that looks impressive in future dollars may buy far less than you expect once inflation is taken into account. By comparing nominal growth with real growth, you can see what your investment will actually be worth in today's purchasing power.
How to Use It
Enter the amount you are investing today (present value), your expected annual nominal return, the expected annual inflation rate, and the number of years you plan to stay invested. The calculator returns three numbers: the inflation-adjusted future value, the nominal future value, and the amount of purchasing power lost to inflation.
The Formula Explained
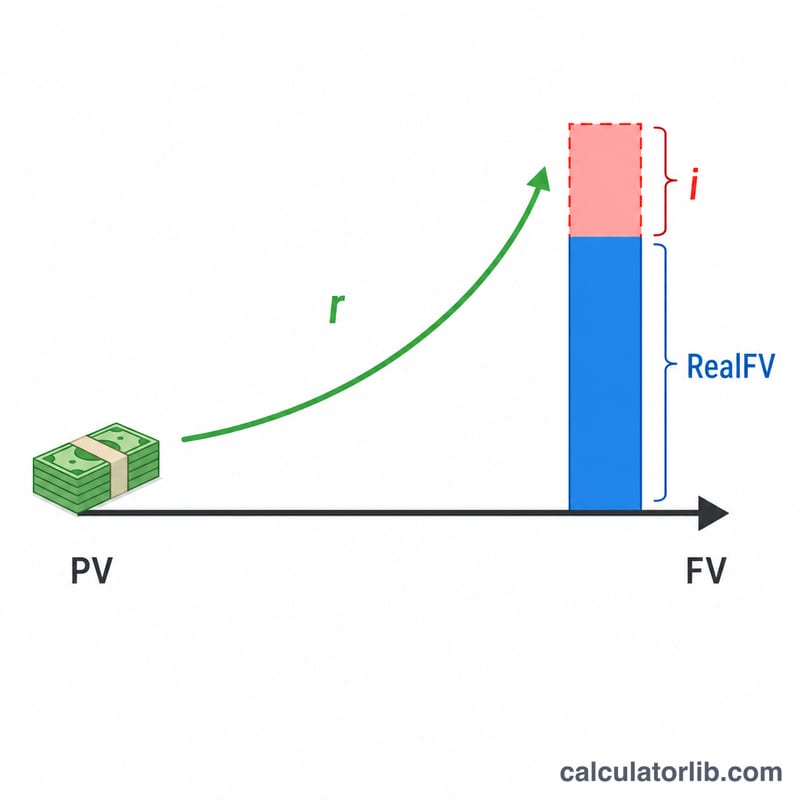
The real future value is computed as $$\text{Real FV} = \frac{\text{PV}\left(1+\dfrac{\text{Return \%}}{100}\right)^{\text{Years}}}{\left(1+\dfrac{\text{Inflation \%}}{100}\right)^{\text{Years}}}$$ where \(r\) is your nominal return rate, \(i\) is inflation, and \(n\) is the number of years. Growing the principal by the nominal rate gives the future dollar amount, and dividing by the cumulative inflation factor converts those future dollars back into today's purchasing power.
Worked Example
Invest $10,000 at a 7% nominal return for 20 years with 3% inflation. The nominal future value is $$10{,}000 \times 1.07^{20} = \$38{,}696.84.$$ Dividing by \(1.03^{20}\) (about \(1.80611\)) gives a real future value of roughly $21,425.50 in today's money. Inflation quietly erodes about $17,271 of that nominal balance's purchasing power.
Inflation in United States: the official figures
Official consumer-price data for United States, updated automatically. Use these figures as inputs in the calculator above.
- 12-month change, September 2026
- +3.7%
- Inflation 2024
- 2.9%
- Cumulative 2015–2024
- 32.3%
- Average per year
- 3.2%
Latest change Up +0.3 pp September 2026: +3.7%, against +3.4% in August 2026.
Latest month (September 2026): consumer prices in United States changed by +3.7% over 12 months (Consumer Price Index for All Urban Consumers, CPI-U). The yearly figures below are annual averages. CalculatorLib calculates this change from the published index: index of the month ÷ index of the same month a year earlier − 1.
Prices in United States changed by 32.3% between 2015 and 2024, an average of 3.2% a year: what cost 100 USD in 2015 cost about 132 USD in 2024.
| Year | CPI (2010 = 100) | Inflation | World |
|---|---|---|---|
| 2024 | 143.9 | 2.9% | 3.0% |
| 2023 | 139.7 | 4.1% | 5.7% |
| 2022 | 134.2 | 8.0% | 8.0% |
| 2021 | 124.3 | 4.7% | 3.5% |
| 2020 | 118.7 | 1.2% | 1.9% |
| 2019 | 117.2 | 1.8% | 2.2% |
| 2018 | 115.2 | 2.4% | 2.5% |
| 2017 | 112.4 | 2.1% | 2.3% |
| 2016 | 110.1 | 1.3% | 1.6% |
| 2015 | 108.7 | 0.1% | 1.4% |
United States and other countries
Inflation, consumer prices (annual %) — each country’s latest published year.
- Türkiye 34.9% (2025)
- Russia 8.7% (2025)
- Mexico 3.8% (2025)
- Vietnam 3.3% (2025)
- Japan 3.2% (2025)
- World 3.0% (2025)
- United States 2.9% (2024)
- India 2.4% (2025)
- South Korea 2.1% (2025)
- Saudi Arabia 2.0% (2025)
- France 0.9% (2025)
- China 0.1% (2025)
No published figure yet for Taiwan.
Years can differ between rows: each figure is shown with its own year. The same World Bank indicator for every country.
Latest figure: 2026-09 Data last updated 2026-11-14 · current
Source: The World Bank Group CC BY 4.0; U.S. Bureau of Labor Statistics (BLS.gov), Consumer Price Index Public domain (U.S. government work)
The cumulative change, the average yearly rate and the price comparison are computed by CalculatorLib from these data.
Source details and methodology
- The World Bank Group — World Development Indicators (FP.CPI.TOTL.ZG, FP.CPI.TOTL)
- U.S. Bureau of Labor Statistics (BLS.gov), Consumer Price Index (CUUR0000SA0)
FAQ
What is the difference between nominal and real value? Nominal value is the raw future dollar amount; real value adjusts that amount for inflation so it reflects what those dollars can actually buy.
What inflation rate should I use? Many investors use a long-run average of around 2–3%, but you can enter any figure that matches your expectations.
Can the real return be negative? Yes. If your nominal return is lower than inflation, the real future value can be less than what you invested, meaning you lost purchasing power.