What Is the Gas Cost Calculator?
The Gas Cost Calculator helps you estimate how much fuel a trip will cost before you set off. Whether you're planning a road trip, budgeting a daily commute, or splitting fuel costs with friends, this tool turns your distance, vehicle efficiency, and current fuel price into a clear dollar (or any currency) figure. It works worldwide because it supports both imperial and metric units — miles or kilometers, miles per gallon (mpg), kilometers per liter (kpl), or liters per 100 km — and lets you enter the price per gallon or per liter to match your region.
How to Use It
- Distance: Enter the total trip distance in miles or kilometers.
- Fuel efficiency: Enter your vehicle's economy using the unit you prefer (mpg, kpl, or L/100 km).
- Fuel price: Enter the current pump price per gallon or per liter.
- The calculator instantly shows how much fuel you'll use and the total cost.
You can find your vehicle's efficiency on the manufacturer's spec sheet, your dashboard trip computer, or by dividing distance traveled by fuel used over a few fill-ups.
The Formula Explained
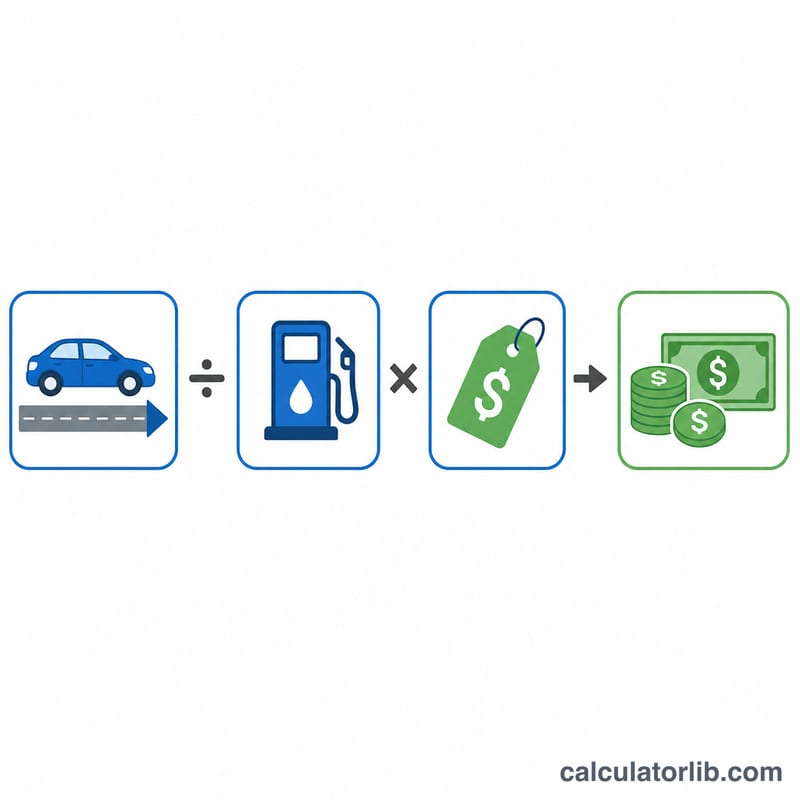
The core math is simple. First, work out the fuel needed, then multiply by price:
$$\text{Trip Cost} = \frac{D}{E} \times P \\[1.5em] \text{where}\quad \left\{ \begin{aligned} D &= \text{Distance}\ (\text{miles}) \\ E &= \text{Efficiency}\ (\text{mpg}) \\ P &= \text{Fuel Price}\ (\text{USD/gal}) \end{aligned} \right.$$- Using mpg: Fuel used = Distance \(\div\) mpg, then Cost = Fuel used \(\times\) price per gallon.
- Using L/100 km: Fuel used = (Distance \(\div\) 100) \(\times\) L/100 km, then Cost = Fuel used \(\times\) price per liter.
Worked Example
Suppose you're driving 300 miles in a car that gets 30 mpg, with gas priced at $3.50 per gallon:
- Fuel used = \(300 \div 30 = 10\) gallons
- Total cost = \(10 \times \$3.50 =\) $35.00
For a metric example: 480 km at 7 L/100 km, fuel at $1.60/L \(\rightarrow (480 \div 100) \times 7 = 33.6\) liters \(\times \$1.60 =\) $53.76.
Fuel Unit and Efficiency Conversions
These volume and length factors are exact by definition:
- 1 US gallon = 3.785411784 litres (exact)
- 1 imperial (UK) gallon = 4.54609 litres (exact)
- 1 mile = 1.609344 km (exact)
The efficiency conversions follow from those definitions:
$$\text{L/100 km} = \frac{235.215}{\text{mpg (US)}} \qquad \text{L/100 km} = \frac{282.481}{\text{mpg (imperial)}}$$$$\text{L/100 km} = \frac{100}{\text{kpl}} \qquad \text{kpl} = \text{mpg (US)} \times 0.425144$$Fuel price converts the same way as volume:
$$\text{price per litre} = \frac{\text{price per US gallon}}{3.785411784}$$So $3.50 per US gallon is about $0.9246 per litre, and €1.60 per litre is about €6.057 per US gallon. Always pair the price unit with the efficiency unit — a price per gallon with an L/100 km figure gives a meaningless answer.
Common equivalents (US mpg basis)
| mpg (US) | L/100 km | km per litre (kpl) | mpg (imperial equivalent) |
|---|---|---|---|
| 15 | 15.7 | 6.4 | 18.0 |
| 20 | 11.8 | 8.5 | 24.0 |
| 25 | 9.4 | 10.6 | 30.0 |
| 30 | 7.8 | 12.8 | 36.0 |
| 40 | 5.9 | 17.0 | 48.0 |
| 50 | 4.7 | 21.3 | 60.0 |
| 60 | 3.9 | 25.5 | 72.1 |
Worked check for one row: \(235.215 \div 20 = 11.76\) L/100 km, and \(20 \times 0.425144 = 8.50\) kpl.
Why the two gallons matter
The imperial gallon used in the United Kingdom is about 20.1% larger than the US gallon (4.54609 L versus 3.785411784 L). A car rated at 40 mpg in UK magazines is roughly 33 mpg on the US scale — the same physical consumption of about 7.1 L/100 km. If your source figure comes from a UK publication, convert it before entering it, or the trip cost will be underestimated by roughly a fifth. Note also that fuel is sold by the US gallon in the United States, by the imperial gallon in a few jurisdictions, and by the litre across most of Europe, Asia, Africa and Latin America (as well as in Canada and the UK at the pump).
Interpreting Your Estimated Trip Cost
The number this calculator returns is fuel cost only, at one assumed price and one steady efficiency figure, for one distance. It does not include tolls, congestion or road-user charges, ferries, parking, tyres, oil, servicing, insurance, registration, depreciation, or the cost of a rental. For an electric vehicle it does not apply at all — that calculation uses kWh and a per-kWh tariff instead of volume and a per-litre or per-gallon price.
Why the real number is usually a little higher
The formula assumes constant consumption over the whole distance. Actual on-road consumption moves with:
- Speed — aerodynamic drag grows with the square of speed, so sustained high-speed motorway running consumes noticeably more per kilometre than a moderate cruise.
- Load and towing — passengers, luggage, roof boxes and trailers add mass and drag.
- Terrain — climbs, mountain passes and constant elevation change raise consumption; only part of the energy comes back on descent.
- Traffic pattern — stop-and-go driving and idling burn fuel while covering little or no distance.
- HVAC use — air conditioning and, in some vehicles, cabin heating draw extra engine load.
- Cold starts and short trips — an engine below operating temperature runs richer, so a series of short hops costs more per mile than one long drive of the same total length.
- Tyre pressure and condition — under-inflated tyres increase rolling resistance.
- Fuel grade and blend — seasonal and ethanol-blended fuels differ slightly in energy content per litre.
For these reasons the result is best read as a baseline, closer to a lower bound than an average, for anything other than gentle steady-state driving. A practical habit is to add a margin of roughly 10–20% for demanding conditions (mountains, heavy load, winter, heavy traffic) and to remember that fuel prices along an unfamiliar route may be higher than at your home station.
Cost per mile or per kilometre
Dividing the total by the distance gives a unit figure you can compare across vehicles, routes and fuel prices:
$$\text{Cost per mile} = \frac{\text{Trip Cost}}{D} = \frac{P}{E}$$Notice the right-hand form: the per-mile fuel cost depends only on price and efficiency, not on how far you drive. Example — a 1,200-mile road trip in a vehicle averaging 25 mpg with fuel at $3.60 per US gallon:
$$\frac{1200\ \text{mi}}{25\ \text{mpg}} = 48\ \text{gal} \qquad 48 \times \$3.60 = \$172.80$$That gives a trip total of $172.80 and a unit cost of $172.80 ÷ 1,200 = $0.144 per mile, which is the same as $3.60 ÷ 25. In metric terms, a car at 6 L/100 km with fuel at €1.60/L costs \(0.06 \times 1.60 = €0.096\) per kilometre.
Splitting the cost between passengers
To share fuel among travellers, divide the total by the number of people contributing:
$$\text{Share per person} = \frac{\text{Trip Cost}}{n}$$The same $172.80 trip split three ways is $57.60 each; split four ways it is $43.20 each. If the group is only sharing part of the route, apply the per-mile figure to the shared segment instead: 400 shared miles × $0.144 = $57.60 to divide. Whether non-fuel costs (tolls, parking, wear) are also shared is an arrangement to agree in advance — this calculator does not model them.
Rated economy versus observed economy
Manufacturer economy figures come from standardised laboratory test cycles — EPA ratings in the United States, WLTP in the European Union and the United Kingdom, and other national procedures elsewhere (for example Japan's WLTC-based labelling). These cycles are designed for comparability between vehicles, not for predicting your specific route, and observed on-road economy commonly differs from the rated figure in either direction. The most reliable input is your own measured average: fill the tank, record the odometer, drive normally, refill, and divide the distance covered by the fuel added. Repeating that over several tanks smooths out fill-level variation and gives a figure that already contains your real driving conditions.
This section is descriptive only. It explains what the arithmetic does and does not cover; it is general information rather than financial or professional advice about vehicle purchases, travel budgets or fuel hedging.
Fuel prices this week: United States
Average retail prices of regular gasoline and diesel across the United States, week of 2026-11-09, taxes included, as published by the U.S. Energy Information Administration. Use them as the fuel price in the calculator above.
- Regular gasoline (2026-11-09)
- $3.995/gal +30.7% since 2025-11-10
- Diesel (2026-11-09)
- $6.127/gal +59.7% since 2025-11-10
World crude oil prices, October 2026
World market prices of crude oil in U.S. dollars per barrel, monthly averages from the World Bank. These are commodity prices, not pump prices: the price at the pump also includes refining, distribution and taxes, and it differs from country to country.
- Crude oil, average of Brent, Dubai and WTI (2026-10)
- $108.50/bbl +72.2% since 2025-10
- Brent (2026-10)
- $125.00/bbl +93.2% since 2025-10
- WTI (2026-10)
- $97.70/bbl +62.3% since 2025-10
- Dubai (2026-10)
- $102.70/bbl +59.7% since 2025-10
Pump prices in the EU, week of 2026-11-09
Pump prices of petrol (Euro-super 95) and diesel by EU country, week of 2026-11-09, taxes included. Use them as the fuel price in the calculator above.
- EU average (petrol)
- 1.877 €/L
| Country | Petrol 95 (€/L) | Diesel (€/L) |
|---|---|---|
| Denmark | 2.391 | 2.435 |
| Netherlands | 2.196 | 2.361 |
| Finland | 2.144 | 2.485 |
| France | 2.088 | 2.178 |
| Germany | 2.067 | 2.253 |
| Greece | 2.042 | 2.099 |
| Italy | 1.995 | 2.218 |
| Ireland | 1.958 | 2.119 |
| Portugal | 1.922 | 2.135 |
| Latvia | 1.846 | 2.083 |
| Romania | 1.844 | 2.033 |
| Belgium | 1.844 | 2.357 |
| Lithuania | 1.843 | 2.225 |
| Estonia | 1.805 | 2.084 |
| Croatia | 1.749 | 2.025 |
| Spain | 1.730 | 1.898 |
| Cyprus | 1.699 | 2.000 |
| Slovakia | 1.691 | 1.965 |
| Hungary | 1.673 | 1.985 |
| Austria | 1.670 | 2.087 |
| Czechia | 1.653 | 1.899 |
| Slovenia | 1.634 | 1.950 |
| Luxembourg | 1.627 | 1.987 |
| Bulgaria | 1.582 | 1.896 |
| Sweden | 1.437 | 1.954 |
| Poland | 1.384 | 1.753 |
| Malta | 1.340 | 1.210 |
Latest figure: 2026-11-09 Data last updated 2026-11-11 · current
Source: U.S. Energy Information Administration (EIA), Gasoline and Diesel Fuel Update Public domain (U.S. government work); World Bank, Commodity Markets (Pink Sheet), modified CC BY 4.0; © European Union, Weekly Oil Bulletin (European Commission) CC BY 4.0
Prices per litre are converted by CalculatorLib from the bulletin's prices per 1,000 litres. Changes over one year are computed by CalculatorLib.
Source details and methodology
- U.S. Energy Information Administration (EIA), Gasoline and Diesel Fuel Update — Weekly retail gasoline and diesel prices
- World Bank, Commodity Markets (Pink Sheet), modified — Commodity Markets (Pink Sheet), monthly prices
- © European Union, Weekly Oil Bulletin (European Commission)
Frequently Asked Questions
Does this account for traffic or terrain? No. The estimate assumes steady, real-world efficiency. Heavy traffic, hills, and aggressive driving raise consumption, so add a buffer of 10–15% for tough conditions.
Can I use it for a round trip? Yes — simply enter the total round-trip distance, or double a one-way figure.
What about electric vehicles? This tool is designed for gasoline and diesel vehicles. EVs use cost per kWh instead, which requires a different calculation.