



How to type a function
Write the right-hand side of y = … in the box; the curve is drawn as soon as it makes sense. Use + - * / ^ and brackets; the multiplication sign can be left out, so 2x, 3sin x and (x+1)(x-1) work. Powers come before the minus sign, as in class: -x^2 is the negative of x squared. Functions: sin cos tan asin acos atan sqrt abs ln log exp floor ceil; log is base 10 and ln is natural. Constants pi and e. Absolute value can be typed as |x - 2|.
Switch to degrees for school trigonometry: then sin(30) is 0.5 and asin(1) is 90.
Worked example
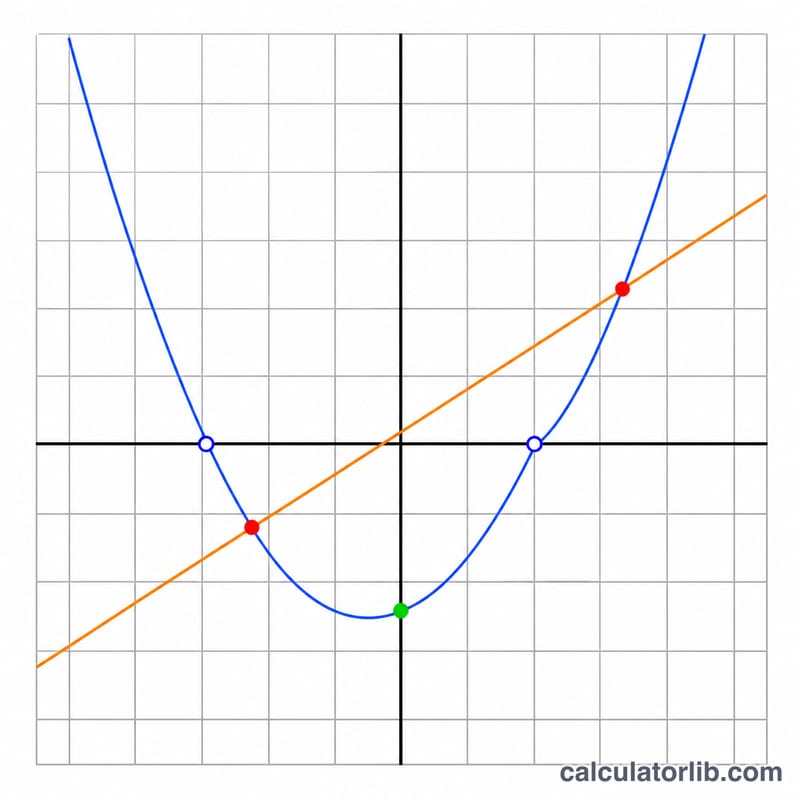
Type x^2 - 2. The parabola crosses the x-axis at x ≈ -1.414 and x ≈ 1.414, the two square roots of 2, and the y-axis at −2. Add x^2 and x + 2 as two functions and the list shows where they meet: (-1; 1) and (2; 4), the solutions of x² = x + 2.
Reading the graph
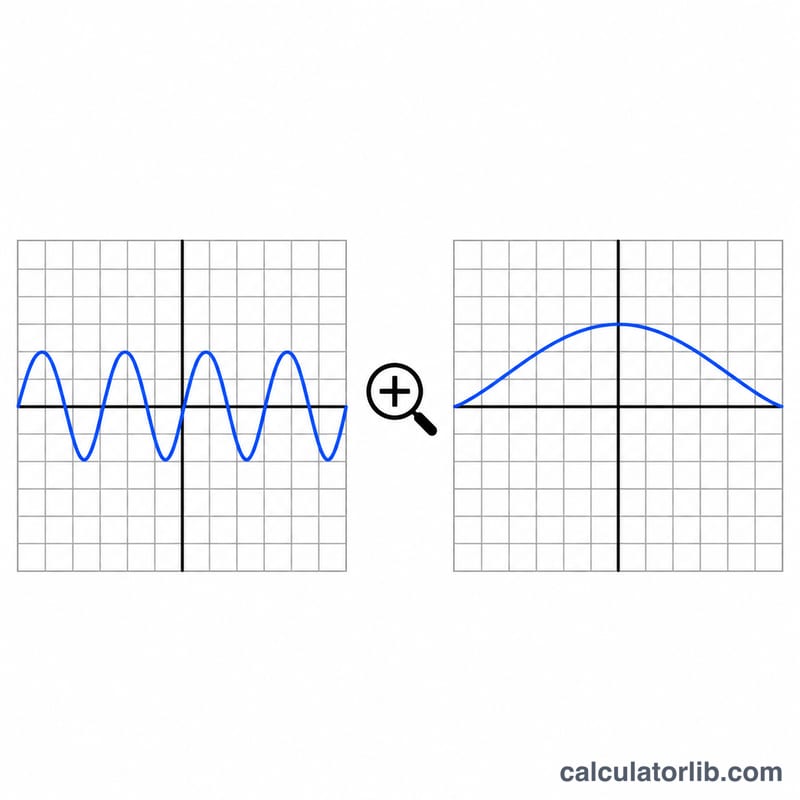
Drag to move the view, pinch or use the wheel to zoom, or the buttons under the graph. Point at a curve to read x and every function's value there; on a keyboard, focus the graph and use the arrow keys. Key points in the view lists the zeros, the y-intercept of each function and where the first two functions meet, for the part of the plane you are looking at. The table of values gives each function at the grid steps. The link in the address bar keeps your functions and view, and Download PNG saves the picture.
Limits
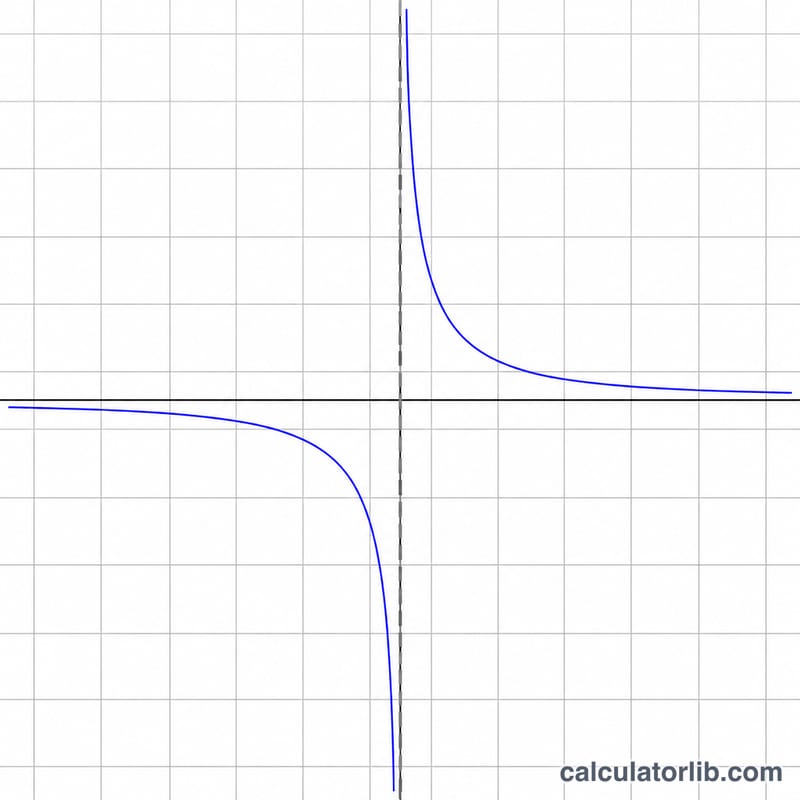
Each function is y in terms of x; curves such as circles written as x² + y² = 1 need two functions (sqrt(1-x^2) and -sqrt(1-x^2)). Zeros and intersections are found numerically inside the view, to about ten significant digits; a zero that only touches the axis is found when the curve reaches it exactly. The line is broken where a function has no value or jumps to infinity, as tan x at 90°, instead of drawing a false vertical line. Nothing you type leaves your browser.