What this calculator does
This tool builds a table of values and a graph for a logarithm function over a range of x values. You can choose the natural logarithm \(\ln(x)\) (base e), the common logarithm \(\log(x)\) (base 10), or a logarithm to any base a, written \(\log_a(x)\). For each x stepping from your start value to your end value by a fixed increment, it computes \(y = f(x)\), lists the (x, y) pairs, and plots the resulting curve.
How to use it
Pick the function from the dropdown. If you select \(\log_a(x)\), enter the base a (it must be greater than 0 and not equal to 1). Set "Range x (from)" and "Range x (to)" plus the "Increment" (step). Choose how many significant digits to display. The calculator iterates through the range, skipping any x value that is zero or negative because the logarithm is undefined there. To keep things responsive the table is capped at 301 rows.
The formula
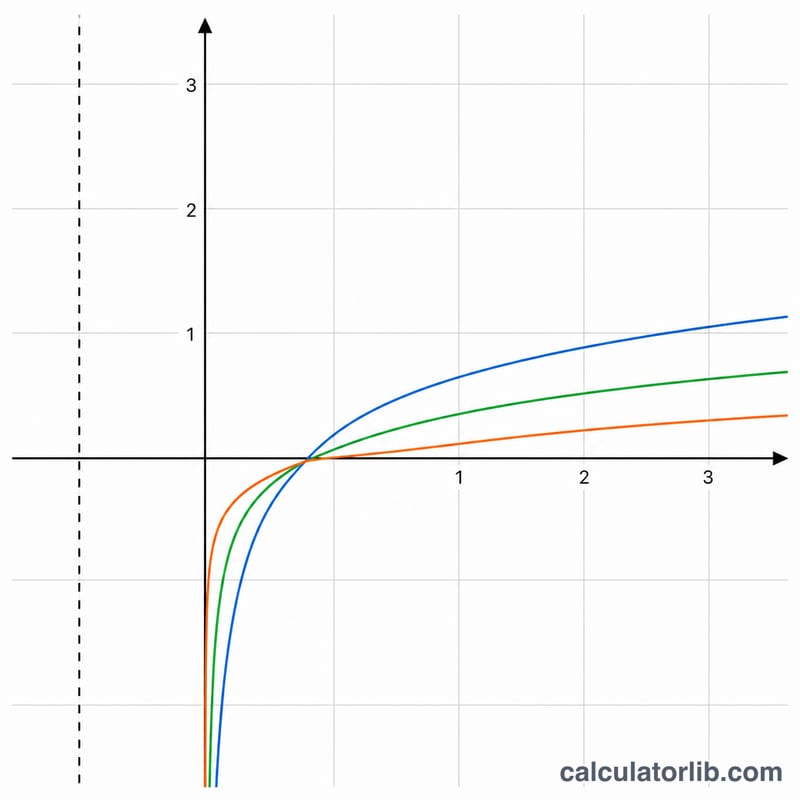
The natural logarithm \(y = \ln(x)\) is the inverse of \(e^x\). The common logarithm is $$y = \log_{10}(x) = \frac{\ln(x)}{\ln(10)}.$$ For an arbitrary base a, the change-of-base formula gives $$\log_a(x) = \frac{\ln(x)}{\ln(a)}.$$ Internally Math.log is the natural log and Math.log10 is base 10. Because \(\ln(a) = 0\) when \(a = 1\), a base of exactly 1 is rejected to avoid division by zero.
Worked example
Choose \(\log_a(x)\) with \(a = 2\), x from 1 to 8, step 1. The change-of-base formula gives: $$\log_2(1)=0,\quad \log_2(2)=1,\quad \log_2(3)=1.584963,\quad \log_2(4)=2,\quad \log_2(5)=2.321928,\quad \log_2(6)=2.584963,\quad \log_2(7)=2.807355,\quad \log_2(8)=3.$$ All 8 rows are defined (every x is positive), so the table has 8 rows and 8 plotted points, with the first point at (1, 0).
FAQ
Why is x = 0 shown as undefined? The logarithm of zero tends to negative infinity, and logs of negative numbers are not real, so those rows are flagged undefined and not plotted; the y-axis behaves as a vertical asymptote.
Can the base be a fraction? Yes. Any a with \(0 < a < 1\) (such as 0.5) is valid and produces a decreasing curve. Only \(a = 1\) and \(a \le 0\) are disallowed.
What does "significant digits" change? It only affects how many figures are shown in the table; the underlying math is always full double precision.