

What Is the Asset Turnover Ratio?
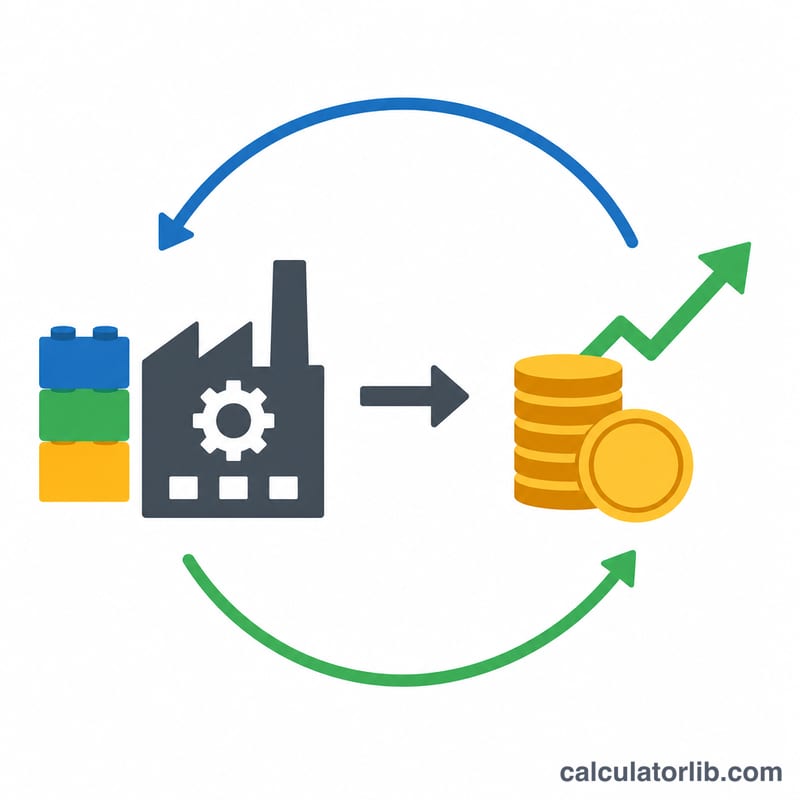
The asset turnover ratio is an efficiency metric that shows how effectively a company uses its assets to generate revenue. It answers a simple question: for every dollar invested in assets, how many dollars of sales does the business produce? A higher ratio generally indicates that management is using assets productively, while a lower ratio may signal underused capacity or asset-heavy operations.
How to Use This Calculator
Enter three figures from the financial statements: the net sales (or total revenue) from the income statement, plus the beginning and ending total assets from the balance sheet. The calculator averages the two asset figures and divides net sales by that average to give the turnover ratio. Compare the result against industry peers, since capital-intensive industries (utilities, manufacturing) naturally run lower ratios than asset-light sectors (retail, services).
The Formula Explained
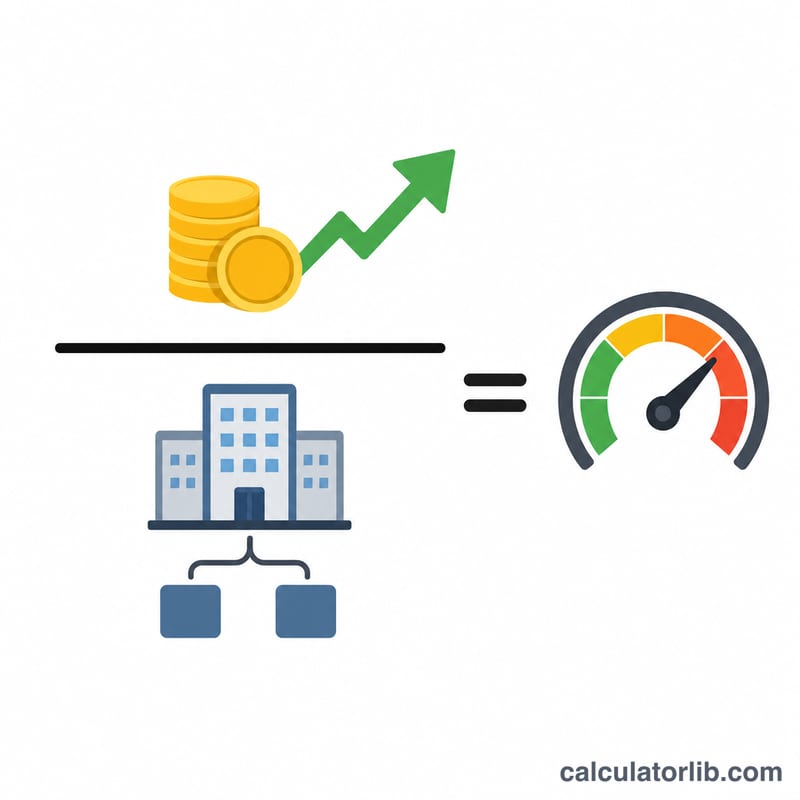
$$\text{Asset Turnover} = \frac{\text{Net Sales}}{\dfrac{\text{Beginning Assets} + \text{Ending Assets}}{2}}$$ where Average Total Assets = (Beginning Total Assets + Ending Total Assets) ÷ 2. Using the average smooths out changes in the asset base over the reporting period, giving a fairer picture than a single point-in-time figure.
Worked Example
Suppose a company reports net sales of $500,000. Its total assets were $200,000 at the start of the year and $300,000 at the end. Average total assets = $$\frac{200{,}000 + 300{,}000}{2} = \$250{,}000$$ Asset turnover = $$\frac{500{,}000}{250{,}000} = 2.0$$ This means the company generated $2 in sales for every $1 of assets.
Typical Asset Turnover Ratios by Industry
The asset turnover ratio measures how many dollars of net sales a company generates for each dollar of assets it holds. "Good" values vary widely by industry because some businesses are asset-light (relying on labor or intellectual property) while others are asset-heavy (relying on plants, networks, or property). The ranges below are approximate industry norms intended for orientation, not precise benchmarks.
| Industry sector | Typical asset turnover range | Why |
|---|---|---|
| Retail & consumer goods | 2.0 – 3.0 | High sales volume relative to modest fixed assets and inventory. |
| Services / staffing | 1.0 – 2.0 | Asset-light models; revenue driven mainly by people. |
| Manufacturing | 0.5 – 1.0 | Significant investment in plant, equipment, and inventory. |
| Utilities | 0.2 – 0.5 | Very large infrastructure base relative to revenue. |
| Real estate | < 0.5 | Property carries a high asset value versus rental income. |
Note: These figures are approximate industry norms and will differ by company size, accounting method, and business cycle. Always compare a firm to direct competitors in the same sector rather than across industries.
Interpreting Your Asset Turnover Ratio
The ratio expresses sales generated per dollar of average assets. A value above 1 means the company produces more than a dollar of revenue for every dollar of assets, generally indicating efficient asset use. A value around 1 means revenue roughly equals the asset base. A value below 1 means assets exceed the revenue they support, which is normal for asset-heavy industries but may signal underused capacity in asset-light ones.
For example, a company with net sales of $2,000,000 and average total assets of $1,000,000 has an asset turnover of 2.0, meaning it generates $2 of sales per $1 of assets.
Why trends matter: A single ratio is a snapshot. Tracking the figure over several years reveals whether asset efficiency is improving (rising ratio) or deteriorating (falling ratio). A declining trend may reflect new capital investment that has not yet produced sales, while a rising trend may reflect better capacity utilization or asset disposals.
Limitations: The ratio can be distorted by the age of assets (older, heavily depreciated assets inflate the ratio because their book value is low), by leasing (leased assets may not appear on the balance sheet, overstating turnover), and by one-time sales or seasonal swings. It also ignores profitability entirely — high turnover at thin margins can still mean weak returns. Pair it with profitability measures such as net profit margin and return on assets for a fuller picture. This is general educational information, not personalized financial advice.
Key Terms Defined
- Net Sales
- Total revenue from goods or services after deducting returns, allowances, and discounts. It is the numerator in the asset turnover formula.
- Total Assets
- The full value of everything a company owns — current assets (cash, receivables, inventory) plus non-current assets (property, plant, equipment, intangibles) — as reported on the balance sheet.
- Beginning Assets
- Total assets at the start of the measurement period, taken from the prior period's closing balance sheet.
- Ending Assets
- Total assets at the close of the measurement period, taken from the current balance sheet.
- Average Total Assets
- The mean of beginning and ending assets, \(\frac{\text{Beginning} + \text{Ending}}{2}\). Using the average smooths out large asset changes during the period so the ratio better reflects assets actually in use.
- Efficiency Ratio
- Any metric (such as asset turnover, inventory turnover, or receivables turnover) that measures how effectively a company converts its resources into sales or cash. Higher efficiency ratios generally indicate more productive use of those resources.
FAQ
What is a good asset turnover ratio? It varies by industry. A ratio above 1 is often healthy, but retailers can exceed 2-3 while heavy manufacturers may sit below 0.5. Always compare within the same sector.
Why use average total assets instead of ending assets? Averaging accounts for asset growth or shrinkage during the year, aligning the asset base with the full period's sales.
Can the ratio be negative? Net sales are normally positive, so the ratio is typically positive. A zero or negative result usually points to a data error or an unusual asset position.