

What this P/E Ratio Calculator does
The price-to-earnings (P/E) ratio is one of the most widely used measures for judging how expensive a stock is relative to the profit it generates. This calculator takes three numbers you provide — the current stock price, earnings per share (EPS), and the average P/E for the company's industry — and instantly returns the P/E ratio plus a plain-language verdict on whether the stock looks cheap or pricey compared with its peers.

The inputs you enter
- Stock Price – the current market price of a single share.
- Earnings Per Share (EPS) – the company's net profit divided by its outstanding shares (usually the trailing twelve months).
- Industry Average P/E – the typical P/E for comparable companies, used as a benchmark for valuation.
The formula
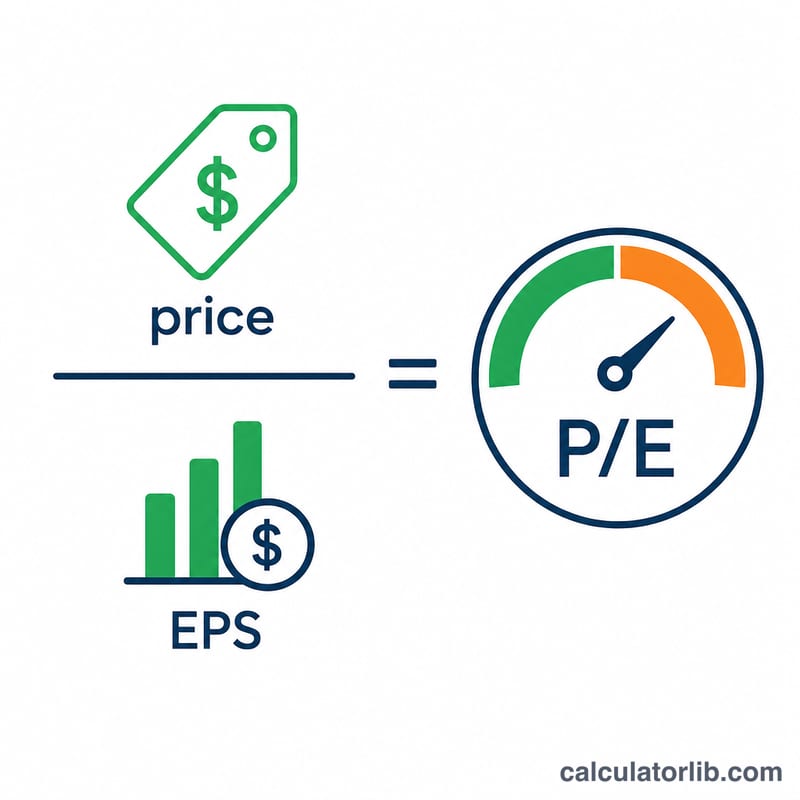
The core calculation is simply:
P/E Ratio = Price per Share ÷ Earnings per Share
The calculator then compares your result against the industry average and assigns a label based on these thresholds: below 70% of the industry P/E is Potentially Undervalued; within ±30% is Fairly Valued; up to twice the industry figure is Potentially Overvalued; above that is Highly Overvalued. A negative or zero ratio is flagged as Invalid (companies with no earnings have no meaningful P/E). It also shows how far your stock sits from the benchmark as a percentage, calculated as (P/E ÷ Industry P/E − 1) × 100.
Worked example
Suppose a stock trades at $150 with EPS of $6, and the industry average P/E is 20.
- P/E Ratio = 150 ÷ 6 = 25
- Industry comparison: 25 is within 30% of 20 (the fair range is 14 to 26), so it is labelled Fairly Valued.
- Relative to industry: (25 ÷ 20 − 1) × 100 = +25%, meaning it trades 25% above the peer average but still inside the fair band.
Frequently asked questions
What is a "good" P/E ratio? There is no universal number — it depends entirely on the industry. A P/E of 25 might be cheap for fast-growing tech but expensive for a utility. That is exactly why this tool compares your result to an industry average rather than a fixed figure.
Why does my result show "Invalid"? If the calculated ratio is zero or negative, the company has no positive earnings, so the P/E cannot be meaningfully interpreted. Check that EPS is a positive number.
Should I use trailing or forward EPS? Either works in the calculator. Trailing EPS uses reported past earnings; forward EPS uses analyst estimates for the year ahead. Just be consistent and use the same basis as the industry average you enter.